 | • レポートコード:MRC7009MY3881 • 出版社/出版日:Grand View Research / 2025年6月 • レポート形態:英語、PDF、170ページ • 納品方法:Eメール(納期:2-3日) • 産業分類:バイオ |
| Single User(1名利用) | ¥904,400 (USD5,950) | ▷ お問い合わせ |
| Multi User(5名利用) | ¥1,056,400 (USD6,950) | ▷ お問い合わせ |
| Corporate User(利用人数無制限) | ¥1,360,400 (USD8,950) | ▷ お問い合わせ |
• お支払方法:銀行振込(納品後、ご請求書送付)
レポート概要
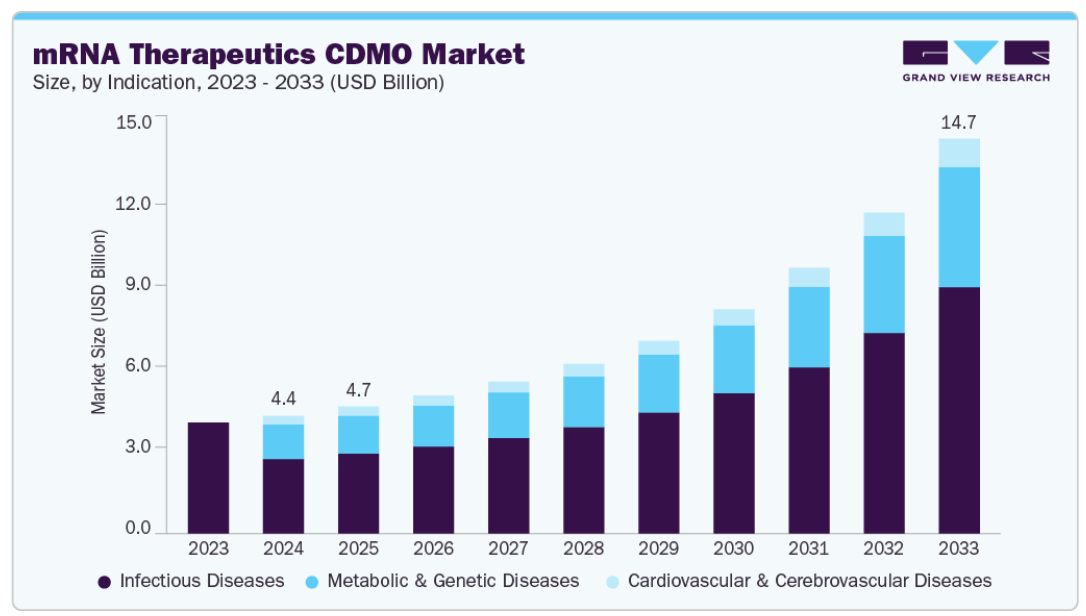
| 世界のmRNA治療薬の受託開発・製造機関(CDMO)市場は、2024年に約44億ドルと推定され、2033年には約147億ドルに達すると予測されており、2025年から2033年にかけて年平均15%超の高い成長が見込まれている。市場拡大の主な要因は、mRNAワクチンの開発加速、感染症やがん患者の増加、臨床ニーズの高度化、さらにデジタル技術の導入による開発・製造プロセスの効率化である。特に新型コロナウイルス感染症の流行を契機に、mRNAワクチンの高い有効性と迅速な開発・供給能力が実証され、この技術の予防・治療用途への期待が急速に高まったことが市場の成長を大きく後押しした。 近年は感染症分野が最大の需要を占めているが、がん、遺伝性疾患、希少疾患などへの応用も拡大しており、研究開発活動や前臨床試験の増加がCDMOサービスへの需要を押し上げている。mRNA技術は迅速な設計、標的特異性、柔軟な改変が可能であることから、次世代治療の基盤として注目されている。また、脂質ナノ粒子(LNP)やポリマーなどの送達技術の革新により、組織特異的発現や安定性が向上し、翻訳効率の改善や免疫原性の低減、反復投与の実現などの研究も進展している。こうした技術進歩は、バイオ医薬企業や学術機関の投資拡大と研究パイプラインの強化を促し、mRNAを汎用的な治療プラットフォームとして確立しつつある。 医薬品企業やバイオ企業による外部委託の拡大も重要な成長機会となっている。mRNA治療薬の製造には、プラスミドDNA生産、in vitro転写、LNP製剤化、無菌充填など高度な専門技術が必要であり、統合的なサービスを提供できる企業は限られている。このため、バリューチェーン全体をカバーするCDMOへの依存が高まっている。さらに、モジュール型GMP施設の導入、革新的LNPのプロセス開発、コールドチェーン物流などの分野でも新たなビジネス機会が生まれている。特に中小バイオ企業は初期研究に注力する傾向が強く、技術力や規制対応能力を備えたCDMOとの長期的パートナーシップが重要視されている。加えて、北米や欧州以外の地域での製造拠点の拡大も進んでおり、アジアなど新興市場での需要が高まっている。 一方、米国の関税政策は原材料コストの上昇を招き、市場に影響を及ぼしている。ヌクレオチドや酵素、特殊脂質などの重要材料は中国や欧州からの調達が多く、コスト増加や供給リスクへの対応として調達戦略の見直しや国内回帰が進んでいる。関税は国内製造の魅力を高める側面もあり、政府支援やパンデミック後の供給網強化政策と相まって、米国内CDMOへの需要増加につながっている。しかし、設備調達の遅延や施設拡張の課題も存在し、柔軟な供給網構築が競争力の鍵となっている。 技術面では、マイクロフルイディクスによるLNP製造、連続生産、モジュール型クリーンルームの導入により、生産期間が大幅に短縮されている。AIやデジタル技術の活用も進み、リアルタイム監視や予測分析によって不良率の低減が実現されている。さらに、転写効率の向上や高純度化、酵素キャッピング技術の革新、冷却管理や自動化無菌充填の高度化により、品質と安定性が向上している。 価格モデルも多様化しており、初期段階では成果連動型やマイルストーン型が主流である。固定料金やサブスクリプション型契約も増加しており、長期的な設備利用や技術支援を確保する動きが強まっている。市場は中程度の集中度を持ちながら、技術革新、規制対応、サービス統合、地域拡大を軸に競争が激化している。特に規制面ではGMP遵守や原材料トレーサビリティ、LNP特性評価が重要となり、品質・データ管理能力が差別化要因となっている。M&Aも徐々に活発化し、独自技術や製造基盤の獲得を目的とした統合が進む見込みである。 用途別ではウイルスワクチンが最大市場を形成しているが、がん免疫療法は最も高い成長が期待される。個別化がんワクチンは次世代シーケンス技術や計算手法を活用した精密医療として注目されている。最終需要先ではバイオ企業が最大シェアを占め、外部委託の拡大と研究投資増加が背景にある。また、政府・学術機関の投資拡大も市場を支えている。 地域別では北米が最大市場であり、研究開発投資、臨床試験、成熟したCDMO基盤が強みとなっている。欧州では戦略提携やインフラ整備が進み、アジア太平洋地域は政府支援、コスト競争力、技術移転の進展により最も高い成長が見込まれる。中南米や中東・アフリカでも臨床試験や投資が増加し、需要が拡大している。主要企業は提携や設備投資を通じて競争力を強化しており、mRNA治療薬の商業化拡大に伴い、CDMOの役割は今後さらに重要になると考えられる。 |
The global mRNA therapeutics CDMO market was valued at USD 4.40 billion in 2024 and is forecast to reach USD 14.75 billion by 2033 (CAGR 15.22% from 2025–2033), driven by expanding mRNA vaccine and therapeutic pipelines, rising infectious disease and cancer burden, evolving clinical requirements, and increasing digitalization of development and manufacturing. North America led in 2024 with a 38.61% share, while Asia Pacific is expected to be the fastest-growing region. Demand is supported by higher R&D activity, more collaborations and investments, and the growing need for specialized, end-to-end capabilities across plasmid DNA, IVT, LNP formulation, and aseptic fill-finish—prompting more pharma and biotech firms to outsource. Technological progress in LNP delivery, modular/continuous manufacturing, and AI-enabled monitoring is improving efficiency, timelines, and scalability, while cold-chain and automated fill-finish upgrades help preserve product stability. The market is also shaped by regulatory expectations around GMP, data integrity, and raw-material traceability, plus moderate but rising M&A as CDMOs acquire platforms and capacity. U.S. tariffs on certain biologics inputs have increased costs for imported nucleotides, enzymes, and lipids, pressuring margins and encouraging supply-chain diversification or reshoring, while also making domestic manufacturing more attractive for some clients.
Segmentation
Indication: Infectious Diseases; Metabolic & Genetic Diseases; Cardiovascular & Cerebrovascular Diseases
Application: Viral Vaccines; Protein Replacement Therapies; Cancer Immunotherapies
End Use: Biotech Companies; Pharmaceutical companies; Government & Academic Research Institutes
Region: North America (U.S., Canada, Mexico); Europe (UK, Germany, France, Italy, Spain, Sweden, Denmark, Norway); Asia Pacific (Japan, China, India, Thailand, South Korea, Australia); Latin America (Brazil, Argentina); Middle East & Africa (South Africa, Saudi Arabia, UAE, Kuwait)
Chapter 1. Research Methodology and Scope
1.1. Market Segmentation & Scope
1.2. Segment Definitions
1.2.1. Indication
1.2.2. Application
1.2.3. End Use
1.3. Research Methodology
1.4. Information Procurement
1.4.1. Purchased Database
1.4.2. GVR’s Internal Database
1.4.3. Secondary Sources
1.4.4. Primary Research
1.5. Information Or Data Analysis
1.5.1. Data Analysis Models
1.6. Market Formulation & Validation
1.7. Model Details
1.7.1. Commodity Flow Analysis
1.7.2. Value-Chain-Based Sizing & Forecasting
1.7.3. Multivariate Model Analysis
1.8. List Of Secondary Sources
1.9. List Of Abbreviations
1.10. Objectives
Chapter 2. Executive Summary
2.1. Market Outlook
2.2. Segment Outlook
2.3. Competitive Insights
Chapter 3. mRNA Therapeutics Contract Development & Manufacturing Organization Market Variables, Trends & Scope
3.1. Market Lineage Outlook
3.1.1. Parent Market Outlook
3.1.2. Related/Ancillary Market Outlook
3.2. Market Dynamics
3.2.1. Market Driver Analysis
3.2.1.1. Rapid adoption of mRNA in vaccine development
3.2.1.2. Multiple research efforts on mRNA therapeutics
3.2.1.3. Major funding for mRNA research
3.2.2. Market Restraint Analysis
3.2.2.1. Availability of low-cost substitute therapies
3.2.2.2. High research cost
3.3. Pricing Model Analysis
3.4. Technology Landscape
3.5. Market Analysis Tools
3.5.1. Porter’s Five Force Analysis
3.5.2. PESTEL by SWOT Analysis
3.5.3. COVID-19 Impact Analysis
Chapter 4. mRNA Therapeutics Contract Development & Manufacturing Organization Market: Indication Estimates & Trend Analysis
4.1. mRNA Therapeutics Contract Development & Manufacturing Organization Market, By Indication: Segment Dashboard
4.2. mRNA Therapeutics Contract Development & Manufacturing Organization Market, By Indication: Movement Analysis
4.3. mRNA Therapeutics Contract Development & Manufacturing Organization Market Estimates & Forecasts, By Indication, 2021 – 2033 (USD Million)
4.4. Infectious Diseases
4.4.1. Infectious Diseases Market Estimates and Forecasts, 2021 – 2033 (USD Million)
4.5. Metabolic & Genetic Diseases
4.5.1. Metabolic & Genetic Diseases Market Estimates and Forecasts, 2021 – 2033 (USD Million)
4.6. Cardiovascular & Cerebrovascular Diseases
4.6.1. Cardiovascular & Cerebrovascular Diseases Market Estimates and Forecasts, 2021 – 2033 (USD Million)
Chapter 5. mRNA Therapeutics Contract Development & Manufacturing Organization Market: Application Estimates & Trend Analysis
5.1. mRNA Therapeutics Contract Development & Manufacturing Organization Market, By Application: Segment Dashboard
5.2. mRNA Therapeutics Contract Development & Manufacturing Organization Market, By Application: Movement Analysis
5.3. mRNA Therapeutics Contract Development & Manufacturing Organization Market Estimates & Forecasts, By Application, 2021 – 2033 (USD Million)
5.4. Viral Vaccines
5.4.1. Viral Vaccines Market Estimates and Forecasts, 2021 – 2033 (USD Million)
5.5. Protein Replacement Therapies
5.5.1. Protein Replacement Therapies Market Estimates and Forecasts, 2021 – 2033 (USD Million)
5.6. Cancer Immunotherapies
5.6.1. Cancer Immunotherapies Market Estimates and Forecasts, 2021 – 2033 (USD Million)
Chapter 6. mRNA Therapeutics Contract Development & Manufacturing Organization Market: End Use Estimates & Trend Analysis
6.1. mRNA Therapeutics Contract Development & Manufacturing Organization Market, By End Use: Segment Dashboard
6.2. mRNA Therapeutics Contract Development & Manufacturing Organization Market, By End Use: Movement Analysis
6.3. mRNA Therapeutics Contract Development & Manufacturing Organization Market Estimates & Forecasts, By End Use, 2021 – 2033 (USD Million)
6.4. Biotech Companies
6.4.1. Biotech Companies Market Estimates and Forecasts, 2021 – 2033 (USD Million)
6.5. Pharmaceutical companies
6.5.1. Pharmaceutical companies Market Estimates and Forecasts, 2021 – 2033 (USD Million)
6.6. Government & Academic Research Institutes
6.6.1. Government & Academic Research Institutes Market Estimates and Forecasts, 2021 – 2033 (USD Million)
Chapter 7. mRNA Therapeutics Contract Development & Manufacturing Organization Market: Regional Estimates & Trend Analysis
7.1. Regional Market Dashboard
7.2. Regional Market Share Analysis, 2024 & 2033
7.3. North America
7.3.1. North America Market Estimates and Forecasts, 2021 – 2033 (USD Million)
7.3.2. U.S
7.3.2.1. Key Country Dynamics
7.3.2.2. Competitive Scenario
7.3.2.3. Regulatory Framework
7.3.2.4. U.S. Market Estimates and Forecasts, 2021 – 2033 (USD Million)
7.3.3. Canada
7.3.3.1. Key Country Dynamics
7.3.3.2. Competitive Scenario
7.3.3.3. Regulatory Framework
7.3.3.4. Canada Market Estimates and Forecasts, 2021 – 2033 (USD Million)
7.3.4. Mexico
7.3.4.1. Key Country Dynamics
7.3.4.2. Competitive Scenario
7.3.4.3. Regulatory Framework
7.3.4.4. Mexico Market Estimates and Forecasts, 2021 – 2033 (USD Million)
7.4. Europe
7.4.1. Europe Market Estimates and Forecasts, 2021 – 2033 (USD Million)
7.4.2. UK
7.4.2.1. Key Country Dynamics
7.4.2.2. Competitive Scenario
7.4.2.3. Regulatory Framework
7.4.2.4. UK Market Estimates and Forecasts, 2021 – 2033 (USD Million)
7.4.3. Germany
7.4.3.1. Key Country Dynamics
7.4.3.2. Competitive Scenario
7.4.3.3. Regulatory Framework
7.4.3.4. Germany Market Estimates and Forecasts, 2021 – 2033 (USD Million)
7.4.4. France
7.4.4.1. Key Country Dynamics
7.4.4.2. Competitive Scenario
7.4.4.3. Regulatory Framework
7.4.4.4. France Market Estimates and Forecasts, 2021 – 2033 (USD Million)
7.4.5. Italy
7.4.5.1. Key Country Dynamics
7.4.5.2. Competitive Scenario
7.4.5.3. Regulatory Framework
7.4.5.4. Italy Market Estimates and Forecasts, 2021 – 2033 (USD Million)
7.4.6. Spain
7.4.6.1. Key Country Dynamics
7.4.6.2. Competitive Scenario
7.4.6.3. Regulatory Framework
7.4.6.4. Spain Market Estimates and Forecasts, 2021 – 2033 (USD Million)
7.4.7. Denmark
7.4.7.1. Key Country Dynamics
7.4.7.2. Competitive Scenario
7.4.7.3. Regulatory Framework
7.4.7.4. Denmark Market Estimates and Forecasts, 2021 – 2033 (USD Million)
7.4.8. Sweden
7.4.8.1. Key Country Dynamics
7.4.8.2. Competitive Scenario
7.4.8.3. Regulatory Framework
7.4.8.4. Sweden Market Estimates and Forecasts, 2021 – 2033 (USD Million)
7.4.9. Norway
7.4.9.1. Key Country Dynamics
7.4.9.2. Competitive Scenario
7.4.9.3. Regulatory Framework
7.4.9.4. Norway Market Estimates and Forecasts, 2021 – 2033 (USD Million)
7.5. Asia Pacific
7.5.1. Asia Pacific Market Estimates and Forecasts, 2021 – 2033 (USD Million)
7.5.2. Japan
7.5.2.1. Key Country Dynamics
7.5.2.2. Competitive Scenario
7.5.2.3. Regulatory Framework
7.5.2.4. Japan Market Estimates and Forecasts, 2021 – 2033 (USD Million)
7.5.3. China
7.5.3.1. Key Country Dynamics
7.5.3.2. Competitive Scenario
7.5.3.3. Regulatory Framework
7.5.3.4. China Market Estimates and Forecasts, 2021 – 2033 (USD Million)
7.5.4. India
7.5.4.1. Key Country Dynamics
7.5.4.2. Competitive Scenario
7.5.4.3. Regulatory Framework
7.5.4.4. India Market Estimates and Forecasts, 2021 – 2033 (USD Million)
7.5.5. Thailand
7.5.5.1. Key Country Dynamics
7.5.5.2. Competitive Scenario
7.5.5.3. Regulatory Framework
7.5.5.4. Thailand Market Estimates and Forecasts, 2021 – 2033 (USD Million)
7.5.6. South Korea
7.5.6.1. Key Country Dynamics
7.5.6.2. Competitive Scenario
7.5.6.3. Regulatory Framework
7.5.6.4. South Korea Market Estimates and Forecasts, 2021 – 2033 (USD Million)
7.5.7. Australia
7.5.7.1. Key Country Dynamics
7.5.7.2. Competitive Scenario
7.5.7.3. Regulatory Framework
7.5.7.4. Australia Market Estimates and Forecasts, 2021 – 2033 (USD Million)
7.6. Latin America
7.6.1. Latin America Market Estimates and Forecasts, 2021 – 2033 (USD Million)
7.6.2. Brazil
7.6.2.1. Key Country Dynamics
7.6.2.2. Competitive Scenario
7.6.2.3. Regulatory Framework
7.6.2.4. Brazil Market Estimates and Forecasts, 2021 – 2033 (USD Million)
7.6.3. Argentina
7.6.3.1. Key Country Dynamics
7.6.3.2. Competitive Scenario
7.6.3.3. Regulatory Framework
7.6.3.4. Argentina Market Estimates and Forecasts, 2021 – 2033 (USD Million)
7.7. MEA
7.7.1. MEA Market Estimates and Forecasts, 2021 – 2033 (USD Million)
7.7.2. South Africa
7.7.2.1. Key Country Dynamics
7.7.2.2. Competitive Scenario
7.7.2.3. Regulatory Framework
7.7.2.4. South Africa Market Estimates and Forecasts, 2021 – 2033 (USD Million)
7.7.3. Saudi Arabia
7.7.3.1. Key Country Dynamics
7.7.3.2. Competitive Scenario
7.7.3.3. Regulatory Framework
7.7.3.4. Saudi Arabia Market Estimates and Forecasts, 2021 – 2033 (USD Million)
7.7.4. UAE
7.7.4.1. Key Country Dynamics
7.7.4.2. Competitive Scenario
7.7.4.3. Regulatory Framework
7.7.4.4. UAE Market Estimates and Forecasts, 2021 – 2033 (USD Million)
7.7.5. Kuwait
7.7.5.1. Key Country Dynamics
7.7.5.2. Competitive Scenario
7.7.5.3. Regulatory Framework
7.7.5.4. Kuwait Market Estimates and Forecasts, 2021 – 2033 (USD Million)
Chapter 8. Competitive Landscape
8.1. Market Participant Categorization
8.2. Company Market Share/Assessment Analysis, 2024
8.3. Company Profiles
8.3.1. Danaher (Aldevron)
8.3.1.1. Company Overview
8.3.1.2. Financial Performance
8.3.1.3. Service Benchmarking
8.3.1.4. Strategic Initiatives
8.3.2. Biomay AG
8.3.2.1. Company Overview
8.3.2.2. Financial Performance
8.3.2.3. Service Benchmarking
8.3.2.4. Strategic Initiatives
8.3.3. Bio-Synthesis, Inc.
8.3.3.1. Company Overview
8.3.3.2. Financial Performance
8.3.3.3. Service Benchmarking
8.3.3.4. Strategic Initiatives
8.3.4. eTheRNA
8.3.4.1. Company Overview
8.3.4.2. Financial Performance
8.3.4.3. Service Benchmarking
8.3.4.4. Strategic Initiatives
8.3.5. Kaneka Eurogentec S.A.
8.3.5.1. Company Overview
8.3.5.2. Financial Performance
8.3.5.3. Service Benchmarking
8.3.5.4. Strategic Initiatives
8.3.6. TriLink BioTechnologies
8.3.6.1. Company Overview
8.3.6.2. Financial Performance
8.3.6.3. Service Benchmarking
8.3.6.4. Strategic Initiatives
8.3.7. ApexBio Technology
8.3.7.1. Company Overview
8.3.7.2. Financial Performance
8.3.7.3. Service Benchmarking
8.3.7.4. Strategic Initiatives
8.3.8. BioNTech SE
8.3.8.1. Company Overview
8.3.8.2. Financial Performance
8.3.8.3. Service Benchmarking
8.3.8.4. Strategic Initiatives
8.3.9. Biocina
8.3.9.1. Company Overview
8.3.9.2. Financial Performance
8.3.9.3. Service Benchmarking
8.3.9.4. Strategic Initiatives
8.3.10. Lonza
8.3.10.1. Company Overview
8.3.10.2. Financial Performance
8.3.10.3. Service Benchmarking
8.3.10.4. Strategic Initiatives
8.3.11. Recipharm AB
8.3.11.1. Company Overview
8.3.11.2. Financial Performance
8.3.11.3. Service Benchmarking
8.3.11.4. Strategic Initiatives
8.3.12. Novo Holdings (Catalent, Inc.)
8.3.12.1. Company Overview
8.3.12.2. Financial Performance
8.3.12.3. Service Benchmarking
8.3.12.4. Strategic Initiatives
8.3.13. Samsung Biologics
8.3.13.1. Company Overview
8.3.13.2. Financial Performance
8.3.13.3. Service Benchmarking
8.3.13.4. Strategic Initiatives
List of Tables
Table 1. List of Secondary Sources
Table 2. List of Abbreviations
Table 3. Global mRNA Therapeutics Contract Development & Manufacturing Organization Market Estimates and Forecasts, by Indication, 2021 – 2033 (USD Million)
Table 4. Global mRNA Therapeutics Contract Development & Manufacturing Organization Market Estimates and Forecasts, by Application, 2021 – 2033 (USD Million)
Table 5. Global mRNA Therapeutics Contract Development & Manufacturing Organization Market Estimates and Forecasts, by End Use, 2021 – 2033 (USD Million)
Table 6. Global mRNA Therapeutics Contract Development & Manufacturing Organization Market Estimates and Forecasts, by Region, 2021 – 2033 (USD Million)
Table 7. North America mRNA Therapeutics Contract Development & Manufacturing Organization Market Estimates and Forecasts, by Country, 2021 – 2033 (USD Million)
Table 8. North America mRNA Therapeutics Contract Development & Manufacturing Organization Market Estimates and Forecasts, by Indication, 2021 – 2033 (USD Million)
Table 9. North America mRNA Therapeutics Contract Development & Manufacturing Organization Market Estimates and Forecasts, by Application, 2021 – 2033 (USD Million)
Table 10. North America mRNA Therapeutics Contract Development & Manufacturing Organization Market Estimates and Forecasts, by End Use, 2021 – 2033 (USD Million)
Table 11. U.S. mRNA Therapeutics Contract Development & Manufacturing Organization Market Estimates and Forecasts, by Indication, 2021 – 2033 (USD Million)
Table 12. U.S. mRNA Therapeutics Contract Development & Manufacturing Organization Market Estimates and Forecasts, by Application, 2021 – 2033 (USD Million)
Table 13. U.S. mRNA Therapeutics Contract Development & Manufacturing Organization Market Estimates and Forecasts, by End Use, 2021 – 2033 (USD Million)
Table 14. Canada mRNA Therapeutics Contract Development & Manufacturing Organization Market Estimates and Forecasts, by Indication, 2021 – 2033 (USD Million)
Table 15. Canada mRNA Therapeutics Contract Development & Manufacturing Organization Market Estimates and Forecasts, by Application, 2021 – 2033 (USD Million)
Table 16. Canada mRNA Therapeutics Contract Development & Manufacturing Organization Market Estimates and Forecasts, by End Use, 2021 – 2033 (USD Million)
Table 17. Mexico mRNA Therapeutics Contract Development & Manufacturing Organization Market Estimates and Forecasts, by Indication, 2021 – 2033 (USD Million)
Table 18. Mexico mRNA Therapeutics Contract Development & Manufacturing Organization Market Estimates and Forecasts, by Application, 2021 – 2033 (USD Million)
Table 19. Mexico mRNA Therapeutics Contract Development & Manufacturing Organization Market Estimates and Forecasts, by End Use, 2021 – 2033 (USD Million)
Table 20. Europe mRNA Therapeutics Contract Development & Manufacturing Organization Market Estimates and Forecasts, by Country, 2021 – 2033 (USD Million)
Table 21. Europe mRNA Therapeutics Contract Development & Manufacturing Organization Market Estimates and Forecasts, by Indication, 2021 – 2033 (USD Million)
Table 22. Europe mRNA Therapeutics Contract Development & Manufacturing Organization Market Estimates and Forecasts, by Application, 2021 – 2033 (USD Million)
Table 23. Europe mRNA Therapeutics Contract Development & Manufacturing Organization Market Estimates and Forecasts, by End Use, 2021 – 2033 (USD Million)
Table 24. UK mRNA Therapeutics Contract Development & Manufacturing Organization Market Estimates and Forecasts, by Indication, 2021 – 2033 (USD Million)
Table 25. UK mRNA Therapeutics Contract Development & Manufacturing Organization Market Estimates and Forecasts, by Application, 2021 – 2033 (USD Million)
Table 26. UK mRNA Therapeutics Contract Development & Manufacturing Organization Market Estimates and Forecasts, by End Use, 2021 – 2033 (USD Million)
Table 27. Germany mRNA Therapeutics Contract Development & Manufacturing Organization Market Estimates and Forecasts, by Indication, 2021 – 2033 (USD Million)
Table 28. Germany mRNA Therapeutics Contract Development & Manufacturing Organization Market Estimates and Forecasts, by Application, 2021 – 2033 (USD Million)
Table 29. Germany mRNA Therapeutics Contract Development & Manufacturing Organization Market Estimates and Forecasts, by End Use, 2021 – 2033 (USD Million)
Table 30. France mRNA Therapeutics Contract Development & Manufacturing Organization Market Estimates and Forecasts, by Indication, 2021 – 2033 (USD Million)
Table 31. France mRNA Therapeutics Contract Development & Manufacturing Organization Market Estimates and Forecasts, by Application, 2021 – 2033 (USD Million)
Table 32. France mRNA Therapeutics Contract Development & Manufacturing Organization Market Estimates and Forecasts, by End Use, 2021 – 2033 (USD Million)
Table 33. Italy mRNA Therapeutics Contract Development & Manufacturing Organization Market Estimates and Forecasts, by Indication, 2021 – 2033 (USD Million)
Table 34. Italy mRNA Therapeutics Contract Development & Manufacturing Organization Market Estimates and Forecasts, by Application, 2021 – 2033 (USD Million)
Table 35. Italy mRNA Therapeutics Contract Development & Manufacturing Organization Market Estimates and Forecasts, by End Use, 2021 – 2033 (USD Million)
Table 36. Spain mRNA Therapeutics Contract Development & Manufacturing Organization Market Estimates and Forecasts, by Indication, 2021 – 2033 (USD Million)
Table 37. Spain mRNA Therapeutics Contract Development & Manufacturing Organization Market Estimates and Forecasts, by Application, 2021 – 2033 (USD Million)
Table 38. Spain mRNA Therapeutics Contract Development & Manufacturing Organization Market Estimates and Forecasts, by End Use, 2021 – 2033 (USD Million)
Table 39. Denmark mRNA Therapeutics Contract Development & Manufacturing Organization Market Estimates and Forecasts, by Indication, 2021 – 2033 (USD Million)
Table 40. Denmark mRNA Therapeutics Contract Development & Manufacturing Organization Market Estimates and Forecasts, by Therapeutics Area, 2021 – 2033 (USD Million)
Table 41. Denmark mRNA Therapeutics Contract Development & Manufacturing Organization Market Estimates and Forecasts, by End Use, 2021 – 2033 (USD Million)
Table 42. Sweden mRNA Therapeutics Contract Development & Manufacturing Organization Market Estimates and Forecasts, by Indication, 2021 – 2033 (USD Million)
Table 43. Sweden mRNA Therapeutics Contract Development & Manufacturing Organization Market Estimates and Forecasts, by Application, 2021 – 2033 (USD Million)
Table 44. Sweden mRNA Therapeutics Contract Development & Manufacturing Organization Market Estimates and Forecasts, by End Use, 2021 – 2033 (USD Million)
Table 45. Norway mRNA Therapeutics Contract Development & Manufacturing Organization Market Estimates and Forecasts, by Indication, 2021 – 2033 (USD Million)
Table 46. Norway mRNA Therapeutics Contract Development & Manufacturing Organization Market Estimates and Forecasts, by Application, 2021 – 2033 (USD Million)
Table 47. Norway mRNA Therapeutics Contract Development & Manufacturing Organization Market Estimates and Forecasts, by End Use, 2021 – 2033 (USD Million)
Table 48. Asia Pacific mRNA Therapeutics Contract Development & Manufacturing Organization Market Estimates and Forecasts, by Country, 2021 – 2033 (USD Million)
Table 49. Asia Pacific mRNA Therapeutics Contract Development & Manufacturing Organization Market Estimates and Forecasts, by Indication, 2021 – 2033 (USD Million)
Table 50. Asia Pacific mRNA Therapeutics Contract Development & Manufacturing Organization Market Estimates and Forecasts, by Application, 2021 – 2033 (USD Million)
Table 51. Asia Pacific mRNA Therapeutics Contract Development & Manufacturing Organization Market Estimates and Forecasts, by End Use, 2021 – 2033 (USD Million)
Table 52. Japan mRNA Therapeutics Contract Development & Manufacturing Organization Market Estimates and Forecasts, by Indication, 2021 – 2033 (USD Million)
Table 53. Japan mRNA Therapeutics Contract Development & Manufacturing Organization Market Estimates and Forecasts, by Application, 2021 – 2033 (USD Million)
Table 54. Japan mRNA Therapeutics Contract Development & Manufacturing Organization Market Estimates and Forecasts, by End Use, 2021 – 2033 (USD Million)
Table 55. China mRNA Therapeutics Contract Development & Manufacturing Organization Market Estimates and Forecasts, by Indication, 2021 – 2033 (USD Million)
Table 56. China mRNA Therapeutics Contract Development & Manufacturing Organization Market Estimates and Forecasts, by Application, 2021 – 2033 (USD Million)
Table 57. China mRNA Therapeutics Contract Development & Manufacturing Organization Market Estimates and Forecasts, by End Use, 2021 – 2033 (USD Million)
Table 58. India mRNA Therapeutics Contract Development & Manufacturing Organization Market Estimates and Forecasts, by Indication, 2021 – 2033 (USD Million)
Table 59. India mRNA Therapeutics Contract Development & Manufacturing Organization Market Estimates and Forecasts, by Therapeutics Area, 2021 – 2033 (USD Million)
Table 60. India mRNA Therapeutics Contract Development & Manufacturing Organization Market Estimates and Forecasts, by End Use, 2021 – 2033 (USD Million)
Table 61. Thailand mRNA Therapeutics Contract Development & Manufacturing Organization Market Estimates and Forecasts, by Indication, 2021 – 2033 (USD Million)
Table 62. Thailand mRNA Therapeutics Contract Development & Manufacturing Organization Market Estimates and Forecasts, by Application, 2021 – 2033 (USD Million)
Table 63. Thailand mRNA Therapeutics Contract Development & Manufacturing Organization Market Estimates and Forecasts, by End Use, 2021 – 2033 (USD Million)
Table 64. South Korea mRNA Therapeutics Contract Development & Manufacturing Organization Market Estimates and Forecasts, by Indication, 2021 – 2033 (USD Million)
Table 65. South Korea mRNA Therapeutics Contract Development & Manufacturing Organization Market Estimates and Forecasts, by Application, 2021 – 2033 (USD Million)
Table 66. South Korea mRNA Therapeutics Contract Development & Manufacturing Organization Market Estimates and Forecasts, by End Use, 2021 – 2033 (USD Million)
Table 67. Australia mRNA Therapeutics Contract Development & Manufacturing Organization Market Estimates and Forecasts, by Indication, 2021 – 2033 (USD Million)
Table 68. Australia mRNA Therapeutics Contract Development & Manufacturing Organization Market Estimates and Forecasts, by Application, 2021 – 2033 (USD Million)
Table 69. Australia mRNA Therapeutics Contract Development & Manufacturing Organization Market Estimates and Forecasts, by End Use, 2021 – 2033 (USD Million)
Table 70. Latin America mRNA Therapeutics Contract Development & Manufacturing Organization Market Estimates and Forecasts, by Country, 2021 – 2033 (USD Million)
Table 71. Latin America mRNA Therapeutics Contract Development & Manufacturing Organization Market Estimates and Forecasts, by Indication, 2021 – 2033 (USD Million)
Table 72. Latin America mRNA Therapeutics Contract Development & Manufacturing Organization Market Estimates and Forecasts, by Application, 2021 – 2033 (USD Million)
Table 73. Latin America mRNA Therapeutics Contract Development & Manufacturing Organization Market Estimates and Forecasts, by End Use, 2021 – 2033 (USD Million)
Table 74. Brazil mRNA Therapeutics Contract Development & Manufacturing Organization Market Estimates and Forecasts, by Indication, 2021 – 2033 (USD Million)
Table 75. Brazil mRNA Therapeutics Contract Development & Manufacturing Organization Market Estimates and Forecasts, by Application, 2021 – 2033 (USD Million)
Table 76. Brazil mRNA Therapeutics Contract Development & Manufacturing Organization Market Estimates and Forecasts, by End Use, 2021 – 2033 (USD Million)
Table 77. Argentina mRNA Therapeutics Contract Development & Manufacturing Organization Market Estimates and Forecasts, by Indication, 2021 – 2033 (USD Million)
Table 78. Argentina mRNA Therapeutics Contract Development & Manufacturing Organization Market Estimates and Forecasts, by Application, 2021 – 2033 (USD Million)
Table 79. Argentina mRNA Therapeutics Contract Development & Manufacturing Organization Market Estimates and Forecasts, by End Use, 2021 – 2033 (USD Million)
Table 80. Middle East & Africa mRNA Therapeutics Contract Development & Manufacturing Organization Market Estimates and Forecasts, by Country, 2021 – 2033 (USD Million)
Table 81. Middle East & Africa mRNA Therapeutics Contract Development & Manufacturing Organization Market Estimates and Forecasts, by Application, 2021 – 2033 (USD Million)
Table 82. Middle East & Africa mRNA Therapeutics Contract Development & Manufacturing Organization Market Estimates and Forecasts, by Indication, 2021 – 2033 (USD Million)
Table 83. Middle East & Africa mRNA Therapeutics Contract Development & Manufacturing Organization Market Estimates and Forecasts, by End Use, 2021 – 2033 (USD Million)
Table 84. South Africa mRNA Therapeutics Contract Development & Manufacturing Organization Market Estimates and Forecasts, by Indication, 2021 – 2033 (USD Million)
Table 85. South Africa mRNA Therapeutics Contract Development & Manufacturing Organization Market Estimates and Forecasts, by Application, 2021 – 2033 (USD Million)
Table 86. South Africa mRNA Therapeutics Contract Development & Manufacturing Organization Market Estimates and Forecasts, by End Use, 2021 – 2033 (USD Million)
Table 87. Saudi Arabia mRNA Therapeutics Contract Development & Manufacturing Organization Market Estimates and Forecasts, by Indication, 2021 – 2033 (USD Million)
Table 88. Saudi Arabia mRNA Therapeutics Contract Development & Manufacturing Organization Market Estimates and Forecasts, by Application, 2021 – 2033 (USD Million)
Table 89. Saudi Arabia mRNA Therapeutics Contract Development & Manufacturing Organization Market Estimates and Forecasts, by End Use, 2021 – 2033 (USD Million)
Table 90. UAE mRNA Therapeutics Contract Development & Manufacturing Organization Market Estimates and Forecasts, by Indication, 2021 – 2033 (USD Million)
Table 91. UAE mRNA Therapeutics Contract Development & Manufacturing Organization Market Estimates and Forecasts, by Application, 2021 – 2033 (USD Million)
Table 92. UAE mRNA Therapeutics Contract Development & Manufacturing Organization Market Estimates and Forecasts, by End Use, 2021 – 2033 (USD Million)
Table 93. Kuwait mRNA Therapeutics Contract Development & Manufacturing Organization Market Estimates and Forecasts, by Indication, 2021 – 2033 (USD Million)
Table 94. Kuwait mRNA Therapeutics Contract Development & Manufacturing Organization Market Estimates and Forecasts, by Application, 2021 – 2033 (USD Million)
Table 95. Kuwait mRNA Therapeutics Contract Development & Manufacturing Organization Market Estimates and Forecasts, by End Use, 2021 – 2033 (USD Million)
List of Figures
Fig. 1 Market research process
Fig. 2 Information procurement
Fig. 3 Primary research pattern
Fig. 4 Market research approaches
Fig. 5 Market formulation & validation
Fig. 6 Commodity flow analysis
Fig. 7 Value-chain-based sizing & forecasting
Fig. 8 QFD model sizing & forecasting
Fig. 9 Bottom-up approach
Fig. 10 Market snapshot
Fig. 11 Segment snapshot 1
Fig. 12 Segment snapshot 2
Fig. 13 Competitive landscape snapshot
Fig. 14 Parent market outlook, 2024 (USD Billion)
Fig. 15 Ancillary market outlook, 2024 (USD Billion)
Fig. 16 mRNA Therapeutics Contract Development & Manufacturing Organization Market Dynamics
Fig. 17 Porter’s five forces analysis
Fig. 18 PESTEL analysis
Fig. 19 mRNA Therapeutics Contract Development & Manufacturing Organization Market: Indication outlook and key takeaways
Fig. 20 mRNA Therapeutics Contract Development & Manufacturing Organization Market: Indication movement analysis
Fig. 21 Infectious Diseases Market Estimates and Forecasts, 2021 – 2033 (USD Million)
Fig. 22 Metabolic & Genetic Diseases Market Estimates and Forecasts, 2021 – 2033 (USD Million)
Fig. 23 Cardiovascular & Cerebrovascular Diseases Market Estimates and Forecasts, 2021 – 2033 (USD Million)
Fig. 24 mRNA Therapeutics Contract Development & Manufacturing Organization Market: Application outlook and key takeaways
Fig. 25 mRNA Therapeutics Contract Development & Manufacturing Organization Market: Application movement analysis
Fig. 26 Viral Vaccines Market Estimates and Forecasts, 2021 – 2033 (USD Million)
Fig. 27 Protein Replacement Therapies Market Estimates and Forecasts, 2021 – 2033 (USD Million)
Fig. 28 Cancer Immunotherapies Market Estimates and Forecasts, 2021 – 2033 (USD Million)
Fig. 29 mRNA Therapeutics Contract Development & Manufacturing Organization Market: End Use outlook and key takeaways
Fig. 30 mRNA Therapeutics Contract Development & Manufacturing Organization Market: End Use movement analysis
Fig. 31 Biotech Companies Market Estimates and Forecasts, 2021 – 2033 (USD Million)
Fig. 32 Pharmaceutical companies Market Estimates and Forecasts, 2021 – 2033 (USD Million)
Fig. 33 Government & Academic Research Institutes Market Estimates and Forecasts, 2021 – 2033 (USD Million)
Fig. 34 Regional Marketplace: Key Takeaways
Fig. 35 North America mRNA Therapeutics Contract Development & Manufacturing Organization Market Estimates and Forecasts, 2021 – 2033 (USD Million)
Fig. 36 Key country dynamics
Fig. 37 U.S. mRNA Therapeutics Contract Development & Manufacturing Organization Market Estimates and Forecasts, 2021 – 2033 (USD Million)
Fig. 38 Key country dynamics
Fig. 39 Canada mRNA Therapeutics Contract Development & Manufacturing Organization Market Estimates and Forecasts, 2021 – 2033 (USD Million)
Fig. 40 Key country dynamics
Fig. 41 Mexico mRNA Therapeutics Contract Development & Manufacturing Organization Market Estimates and Forecasts, 2021 – 2033 (USD Million)
Fig. 42 Europe mRNA Therapeutics Contract Development & Manufacturing Organization Market Estimates and Forecasts, 2021 – 2033 (USD Million)
Fig. 43 Key country dynamics
Fig. 44 UK mRNA Therapeutics Contract Development & Manufacturing Organization Market Estimates and Forecasts, 2021 – 2033 (USD Million)
Fig. 45 Key country dynamics
Fig. 46 Germany mRNA Therapeutics Contract Development & Manufacturing Organization Market Estimates and Forecasts, 2021 – 2033 (USD Million)
Fig. 47 Key country dynamics
Fig. 48 France mRNA Therapeutics Contract Development & Manufacturing Organization Market Estimates and Forecasts, 2021 – 2033 (USD Million)
Fig. 49 Key country dynamics
Fig. 50 Italy mRNA Therapeutics Contract Development & Manufacturing Organization Market Estimates and Forecasts, 2021 – 2033 (USD Million)
Fig. 51 Key country dynamics
Fig. 52 Spain mRNA Therapeutics Contract Development & Manufacturing Organization Market Estimates and Forecasts, 2021 – 2033 (USD Million)
Fig. 53 Key country dynamics
Fig. 54 Denmark mRNA Therapeutics Contract Development & Manufacturing Organization Market Estimates and Forecasts, 2021 – 2033 (USD Million)
Fig. 55 Key country dynamics
Fig. 56 Sweden mRNA Therapeutics Contract Development & Manufacturing Organization Market Estimates and Forecasts, 2021 – 2033 (USD Million)
Fig. 57 Key country dynamics
Fig. 58 Norway mRNA Therapeutics Contract Development & Manufacturing Organization Market Estimates and Forecasts, 2021 – 2033 (USD Million)
Fig. 59 Asia Pacific mRNA Therapeutics Contract Development & Manufacturing Organization Market Estimates and Forecasts, 2021 – 2033 (USD Million)
Fig. 60 Key country dynamics
Fig. 61 Japan mRNA Therapeutics Contract Development & Manufacturing Organization Market Estimates and Forecasts, 2021 – 2033 (USD Million)
Fig. 62 Key country dynamics
Fig. 63 China mRNA Therapeutics Contract Development & Manufacturing Organization Market Estimates and Forecasts, 2021 – 2033 (USD Million)
Fig. 64 Key country dynamics
Fig. 65 India mRNA Therapeutics Contract Development & Manufacturing Organization Market Estimates and Forecasts, 2021 – 2033 (USD Million)
Fig. 66 Key country dynamics
Fig. 67 Thailand mRNA Therapeutics Contract Development & Manufacturing Organization Market Estimates and Forecasts, 2021 – 2033 (USD Million)
Fig. 68 Key country dynamics
Fig. 69 South Korea mRNA Therapeutics Contract Development & Manufacturing Organization Market Estimates and Forecasts, 2021 – 2033 (USD Million)
Fig. 70 Key country dynamics
Fig. 71 Australia mRNA Therapeutics Contract Development & Manufacturing Organization Market Estimates and Forecasts, 2021 – 2033 (USD Million)
Fig. 72 Latin America mRNA Therapeutics Contract Development & Manufacturing Organization Market Estimates and Forecasts, 2021 – 2033 (USD Million)
Fig. 73 Key country dynamics
Fig. 74 Brazil mRNA Therapeutics Contract Development & Manufacturing Organization Market Estimates and Forecasts, 2021 – 2033 (USD Million)
Fig. 75 Key country dynamics
Fig. 76 Argentina mRNA Therapeutics Contract Development & Manufacturing Organization Market Estimates and Forecasts, 2021 – 2033 (USD Million)
Fig. 77 MEA mRNA Therapeutics Contract Development & Manufacturing Organization Market Estimates and Forecasts, 2021 – 2033 (USD Million)
Fig. 78 Key country dynamics
Fig. 79 South Africa mRNA Therapeutics Contract Development & Manufacturing Organization Market Estimates and Forecasts, 2021 – 2033 (USD Million)
Fig. 80 Key country dynamics
Fig. 81 Saudi Arabia mRNA Therapeutics Contract Development & Manufacturing Organization Market Estimates and Forecasts, 2021 – 2033 (USD Million)
Fig. 82 Key country dynamics
Fig. 83 UAE mRNA Therapeutics Contract Development & Manufacturing Organization Market Estimates and Forecasts, 2021 – 2033 (USD Million)
Fig. 84 Key country dynamics
Fig. 85 Kuwait mRNA Therapeutics Contract Development & Manufacturing Organization Market Estimates and Forecasts, 2021 – 2033 (USD Million)
Fig. 86 Key company categorization
Fig. 87 Service heat map analysis
Fig. 88 Strategic framework
市場 2024-2031") 世界の光学的透明接着剤(OCA)市場 2024-2031 Optically clear adhesives (OCA) are transparent and uncoloured adhesives that allow bonding of the entire surface area of a screen to the devices without any distortion display. The optical clarity is an important aspect of these adhesives as it is clean & high in transparency hence used in most cri…
世界の光学的透明接着剤(OCA)市場 2024-2031 Optically clear adhesives (OCA) are transparent and uncoloured adhesives that allow bonding of the entire surface area of a screen to the devices without any distortion display. The optical clarity is an important aspect of these adhesives as it is clean & high in transparency hence used in most cri…市場2025-2031") 世界の光学的透明接着剤(OCA)市場2025-2031 The global Optically Clear Adhesive market size was US$ 1360 million in 2024 and is forecast to a readjusted size of US$ 1892 million by 2031 with a CAGR of 4.9% during the forecast period 2025-2031. The North America Optically Clear Adhesive market size was US$ million in 2024, while Europe was US$…
世界の光学的透明接着剤(OCA)市場2025-2031 The global Optically Clear Adhesive market size was US$ 1360 million in 2024 and is forecast to a readjusted size of US$ 1892 million by 2031 with a CAGR of 4.9% during the forecast period 2025-2031. The North America Optically Clear Adhesive market size was US$ million in 2024, while Europe was US$…- 世界のグリーン通信・持続可能なIT市場(~2032) According to Stratistics MRC, the Global Green Telecom & Sustainable IT Market is accounted for $6.24 billion in 2025 and is expected to reach $26.61 billion by 2032 growing at a CAGR of 23.0% during the forecast period. Sustainable IT and Green Telecom aim to lower the ecological impact of communic…
- 冷媒の世界市場2025-2033 The global refrigerant market size reached USD 21.9 Billion in 2024. Looking forward, IMARC Group expects the market to reach USD 40.7 Billion by 2033, exhibiting a growth rate (CAGR) of 8.06% during 2025-2033. The increasing need for cooling solutions due to global climate changes, continual advanc…
- 世界の自動車金属部品市場2025 The global Automotive Metal Parts market size was US$ million in 2024 and is forecast to a readjusted size of US$ million by 2031 with a CAGR of %during the forecast period 2025-2031. Automotive industry metal parts are components or parts that made of metal materials of automotives. Automotive is a…