 | • レポートコード:MRC05528YL993 • 出版社/出版日:DataM Intelligence / 2024年12月 • レポート形態:英語、PDF、約180ページ • 納品方法:Eメール(納期:2営業日) • 産業分類:医療 |
| Single User | ¥661,200 (USD4,350) | ▷ お問い合わせ |
| Five User | ¥737,200 (USD4,850) | ▷ お問い合わせ |
| Enterprise User | ¥1,193,200 (USD7,850) | ▷ お問い合わせ |
• お支払方法:銀行振込(納品後、ご請求書送付)
レポート概要
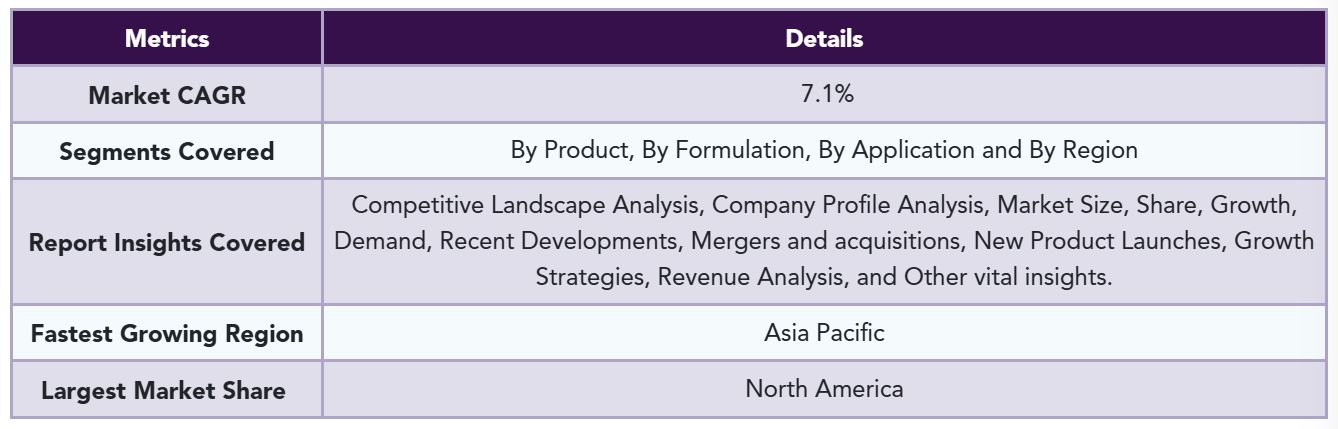
癒着防止材市場は、2024年から2031年にかけて年平均成長率(CAGR)7.1%で成長すると予測されています。癒着防止材とは、外科手術において臓器や組織間の異常な癒着を防ぐために使用される医療用インプラントであり、腹部、整形外科、婦人科、心血管、泌尿器、再建手術など幅広い分野で用いられています。中でも心血管手術での使用が特に多く、フィルム状やゲル状の製品が主流です。
市場の主な成長要因としては、慢性疾患やスポーツ外傷の増加に加え、高齢化の進行とそれに伴う疾患リスクの上昇が挙げられます。高齢者人口の増加は糖尿病や慢性潰瘍といった疾患の増加につながり、術後感染の予防目的で癒着防止材の活用が拡大しています。国連の報告によれば、60歳以上の人口は2017年に9億6200万人に達し、2050年にはその倍、2100年には3倍に達すると見込まれています。
さらに、事故による外傷に伴う手術件数の増加も市場を後押ししています。美容外科や緊急手術など様々な手術で癒着防止材が用いられ、米国では2017年に約1,750万件の外科・低侵襲手術が実施されたと報告されています。
一方で、新型コロナウイルス感染症(COVID-19)の影響により、2020年には世界的に手術件数が減少し、市場も一時的に縮小しましたが、今後は回復とともに成長が見込まれます。
製品別では、合成タイプが市場シェアの大半を占めており、コストパフォーマンスの高さと供給の安定性から、今後も主流であり続けると予想されます。剤形別ではフィルムタイプが最も普及しており、臨床データによる有効性の裏付けと使いやすさから、医師に好まれています。
地域別では、北米が最大市場で、特に米国では心血管疾患の多さや整形外科分野でのニーズが市場をけん引しています。BaxterやJohnson & Johnsonなどの大手企業がこの地域で強い存在感を示しています。アジア太平洋地域でも医療インフラ整備や高齢化、慢性疾患の増加により、市場の成長が加速しています。
競争環境は激しく、Baxter、Johnson & Johnson、Terumo、W.L. Gore & Associates などが主要プレーヤーとして市場をリードしています。2020年にはBaxterがSanofiからSeprafilmの事業を買収し、米国、中国、日本、韓国、フランスなどでのプレゼンスを強化しました。このような買収や新製品の投入により、企業はグローバルな市場展開を進めています。
The Global Adhesion Barrier market is expected to grow at a CAGR of 7.1% during the forecasting period (2024-2031).
An adhesion barrier is referred to as a medical implant that is used to reduce abnormal internal damage by performing surgery by splitting the internal tissues and organs. North America dominated the global adhesion barrier market and is expected to retain its position during the forecast period. Competitive rivalry intensifies Baxter International, Johnson & Johnson Services, Inc., Terumo Corporation and others operating in the market.
It is used in several surgical procedures, including abdominal, orthopedic, gynecological, reconstructive, cardiovascular, and urological surgeries. Moreover, the adhesion barriers find their most significant application in cardiovascular surgeries to restore the coronary artery. The film and gel formulations of adhesion barriers are majorly used as compared to the liquid formulation.
Market Dynamics
The rising prevalence of chronic diseases and the rising number of sports-related injuries are some factors that are expected to propel market growth. Moreover, the rising awareness regarding the medical implications of adhesion barriers and the increasing geriatric population is further supporting the growth of the market across the globe.
The rising geriatric population will continue supporting the growth of the market during the forecast period.
The rising ageing population encourages the possibility of diabetes that results in wound infections and chronic ulcers—the increasing application of adhesion barriers for reducing infections driving the adhesion barrier market. Every country has an increasing number and proportion of ageing people in its population across the globe. The ageing population is one of the most significant social transformations of the present scenario. According to the United Nations, people aged over 60 years were recorded to be around 962 million in 2017 worldwide. This number is further expected to get doubled by 2050 and tripled by 2100. The global population with age 60 years and more is growing faster than the population of younger age groups, which in turn, is contributing to the growth of the market across the globe.
An increasing number of injuries is driving the growth of the global market.
The rising number of surgeries for accidental injuries raises the demand for the adhesion barrier. Several surgeries utilize adhesion barriers, such as elective surgery, emergency surgery, exploratory surgery, cosmetic surgery, etc. According to the American Society for Aesthetic Plastic Surgery (ASAPS), surgical procedures estimate for around 60% of healthcare globally, and nonsurgical procedures accounted for around 40% of the total expenditures globally. There were around 17.5 million surgical and minimally invasive cosmetic procedures performed in the US in 2017 that were 17.8 million in 2016, according to the (ASAPS). This, in turn, is further expected to propel the market growth during the forecast period.
COVID-19 Impact Analysis on Market
The outbreak of COVID-19 has certainly impacted the global adhesion barrier market, backed by the decline in surgical procedures worldwide. During March-August 2020, surgical procedures declined rapidly across the globe, which has hampered the sale of adhesion barriers globally. Therefore, the adhesion barrier market is expected to foresee a considerable decline in 2020.
Market Segmentation Analysis
The adhesion barrier market has been classified into synthetic adhesion barriers and natural adhesion barriers based on the product.
The synthetic adhesion barrier segment accounted for the highest market share in the global market.
Synthetic adhesion barriers contributed to the major share in the adhesion barrier market in 2019 and will project a significant CAGR during the forecast period. These adhesion barriers find their prominent use in post-surgical adhesion prevention products. The synthetic adhesion barriers are cost-effective, owing to which the sale of synthetic adhesion barriers is expected to escalate during the forecast period.
Based on the formulation, the adhesion barrier market has been segmented into film formulation, gel formulation, and liquid formulation.
The film Formulation segment dominated the global adhesion barrier market in 2019. Film formulation dominated the adhesion barrier market in 2019 and is expected to retain its position by exhibiting a considerable CAGR during the forecast period. The major factors driving the growth of the segment in the market include the availability of a broad range of film-form adhesion barriers in the market coupled with the strong clinical support assisting the efficacy of these adhesion barriers in the healthcare sector. Moreover, the ease of use is further increasing the adoption of film-form adhesion barriers, especially among surgeons, related to gel- and liquid-form adhesion barriers.
Market Geographical Share
Based on geography, the study analyzes the adhesion barrier market globally, including North America, Europe, Asia-Pacific, South America, and the Middle East & Africa.
North America leads the global market throughout the forecast period.
North America dominated the global adhesion barrier market and is expected to retain its position during the forecast period. The US contributed over 85.0% to the North American adhesion barrier market in 2019. The increasing prevalence of cardiovascular diseases and treatment for orthopedic conditions contributes to the rise in demand for adhesion barriers in the region. Moreover, key players, such as Becton Dickinson and Company, Baxter International, and Johnson and Johnson, further support the region’s adhesion barrier market.
The Asia Pacific is estimated to grow at a considerable growth rate in the adhesion barrier market during the forecast period. This growth can be accredited to high healthcare spending on establishing advanced healthcare infrastructure and supporting medical tourism. Moreover, the rising geriatric population in Southeast Asia and an increasing prevalence of chronic diseases, such as cardiovascular diseases, are augmenting the market growth in the region.
Companies and Competitive Landscape
The adhesion barrier market is highly competitive. The key adhesion barrier players contributing to the global market’s growth include Baxter International, Johnson & Johnson Services, Inc., Terumo Corporation, W.L. Gore & Associates, CorMatrix Cardiovascular Inc., and AlloSource, Inc. The major players are adopting new product launch and expansion strategies for global growth in the adhesion barrier market. For instance, in February 2020, Baxter International completed its acquisition of Seprafilm Adhesion Barrier and related assets from Sanofi for $350 million. Seprafilm has a global commercial presence in the U.S., China, Japan, South Korea, and France, among other countries.
Baxter International Overview:
Baxter International was established in the year 1931, and it is headquartered in Deerfield, Illinois. Healthcare company that was founded in 1931. The company makes a wide variety of medicines and medical products through its two divisions: health products and renal. Baxter’s hospital products unit manufactures products to deliver fluids and drugs to patients across the continuum of care. These include Intravenous (IV) and other sterile solutions and administration sets, IV nutrition products, infusion pumps, premixed drugs, drug-reconstitution systems, and inhalation anaesthetics. The business also offers products and services regarding drug formulation, pharmacy compounding, and packaging technologies. The company offers general anesthetic agents and critical care drugs, and drug packaging and formulation technologies.
Product Portfolio: The company manufactures numerous products, including Seprafilm.
- Methodology and Scope
- Research Methodology
- Research Objective and Scope of the Report
- Market Definition and Overview
- Executive Summary
- Market Snippet by Product
- Market Snippet by Formulation
- Market Snippet by Application
- Market Snippet by Region
- Market Dynamics
- Market Impacting Factors
- Drivers
- Rising geriatric population
- Increasing sports-related injuries
- Restraints:
- Product recalls
- Opportunity
- Impact Analysis
- Drivers
- Market Impacting Factors
- Industry Analysis
- Porter’s Five Forces Analysis
- Supply Chain Analysis
- Value Chain Analysis
- PEST Analysis
- Pricing Analysis
- Regulatory Analysis
- Reimbursement Analysis
- Unmet Needs
- Patent Trends
- COVID-19 Analysis
- Analysis of Covid-19 on the Market
- Before COVID-19 Market Scenario
- Present COVID-19 Market Scenario
- After COVID-19 or Future Scenario
- Pricing Dynamics Amid Covid-19
- Demand-Supply Spectrum
- Government Initiatives Related to the Market During Pandemic
- Manufacturers Strategic Initiatives
- Conclusion
- Analysis of Covid-19 on the Market
- By Product
- Introduction
- Market Size Analysis, and Y-o-Y Growth Analysis (%), By Product Segment
- Market Attractiveness Index, By Product Segment
- Synthetic Adhesion Barriers*
- Introduction
- Market Size Analysis, and Y-o-Y Growth Analysis (%)
- Natural Adhesion Barriers
- Synthetic Adhesion Barriers*
- By Formulation
- Introduction
- Market Size Analysis, and Y-o-Y Growth Analysis (%), By Formulation Segment
- Market Attractiveness Index, By Formulation Segment
- Film Formulation*
- Introduction
- Market Size Analysis, and Y-o-Y Growth Analysis (%)
- Liquid Formulation
- Gel Formulation
- Film Formulation*
- By Application
- Introduction
- Market Size Analysis, and Y-o-Y Growth Analysis (%), By Application Segment
- Market Attractiveness Index, By Application Segment
- Gynecological Surgeries*
- Introduction
- Market Size Analysis, and Y-o-Y Growth Analysis (%)
- General/Abdominal Surgeries
- Cardiovascular Surgeries
- Neurological Surgeries
- Others
- Gynecological Surgeries*
- By Region
- Introduction
- Market Size Analysis, and Y-o-Y Growth Analysis (%), By Region
- Market Attractiveness Index, By Region
- North America
- Introduction
- Key Region-Specific Dynamics
- Market Size Analysis, and Y-o-Y Growth Analysis (%), By Product
- Market Size Analysis, and Y-o-Y Growth Analysis (%), By Formulation
- Market Size Analysis, and Y-o-Y Growth Analysis (%), By Application
- Market Size Analysis, and Y-o-Y Growth Analysis (%), By Country
- The U.S.
- Canada
- Mexico
- Europe
- Introduction
- Key Region-Specific Dynamics
- Market Size Analysis, and Y-o-Y Growth Analysis (%), By Product
- Market Size Analysis, and Y-o-Y Growth Analysis (%), By Formulation
- Market Size Analysis, and Y-o-Y Growth Analysis (%), By Application
- Market Size Analysis, and Y-o-Y Growth Analysis (%), By Country
- Germany
- The U.K.
- France
- Italy
- Spain
- Rest of Europe
- South America
- Introduction
- Key Region-Specific Dynamics
- Market Size Analysis, and Y-o-Y Growth Analysis (%), By Product
- Market Size Analysis, and Y-o-Y Growth Analysis (%), By Formulation
- Market Size Analysis, and Y-o-Y Growth Analysis (%), By Application
- Market Size Analysis, and Y-o-Y Growth Analysis (%), By Country
- Brazil
- Argentina
- Rest of South America
- Asia Pacific
- Introduction
- Key Region-Specific Dynamics
- Market Size Analysis, and Y-o-Y Growth Analysis (%), By Product
- Market Size Analysis, and Y-o-Y Growth Analysis (%), By Formulation
- Market Size Analysis, and Y-o-Y Growth Analysis (%), By Application
- Market Size Analysis, and Y-o-Y Growth Analysis (%), By Country
- China
- India
- Japan
- Australia
- Rest of Asia Pacific
- The Middle East and Africa
- Introduction
- Key Region-Specific Dynamics
- Market Size Analysis, and Y-o-Y Growth Analysis (%), By Product
- Market Size Analysis, and Y-o-Y Growth Analysis (%), By Formulation
- Market Size Analysis, and Y-o-Y Growth Analysis (%), By Application
- Market Size Analysis, and Y-o-Y Growth Analysis (%), By Country
- Competitive Landscape
- Competitive Scenario
- Market Positioning/Share Analysis
- Mergers and Acquisitions Analysis
- Company Profiles
- Baxter International*
- Company Overview
- Product Portfolio and Description
- Key Highlights
- Financial Overview
- Johnson & Johnson Services, Inc.
- Becton, Dickinson, and Company
- Anika Therapeutics
- Terumo Corporation
- W.L. Gore & Associates
- BiosCompass
- AlloSource, Inc.
- CorMatrix Cardiovascular Inc.
- Innocoll Holdings Limited
- Shin Poong Pharm.co., Ltd.
- Hangzhou Singclean Medical Products Co., Ltd.
- Shandong Shuangyuan Sealing Technology Co., Ltd.
- Dongguan Kangda (Kungmedi) Medical Technology Co., Ltd.(*LIST NOT EXHAUSTIVE)
- Baxter International*
- DataM Intelligence
- Appendix
- About Us and Services
- Contact Us
List of Tables
Table 1 Global Adhesion Barrier Market Value, By Product, 2023, 2027& 2031 (US$ Million)
Table 2 Global Adhesion Barrier Market Value, By Formulation, 2023, 2027& 2031 (US$ Million)
Table 3 Global Adhesion Barrier Market Value, By Application, 2023, 2027& 2031 (US$ Million)
Table 4 Global Adhesion Barrier Market Value, By Region, 2023, 2027& 2031 (US$ Million)
Table 5 North America Adhesion Barrier Market Value, By Product, 2023, 2027& 2031 (US$ Million)
Table 6 North America Adhesion Barrier Market Value, By Formulation, 2023, 2027& 2031 (US$ Million)
Table 7 North America Adhesion Barrier Market Value, By Application, 2023, 2027& 2031 (US$ Million)
Table 8 North America Adhesion Barrier Market Value, By Country, 2022-2031 (US$ Million)
Table 9 South America Adhesion Barrier Market Value, By Product, 2023, 2027& 2031 (US$ Million)
Table 10 South America Adhesion Barrier Market Value, By Formulation, 2023, 2027& 2031 (US$ Million)
Table 11 South America Adhesion Barrier Market Value, By Application, 2023, 2027& 2031 (US$ Million)
Table 12 South America Adhesion Barrier Market Value, By Country, 2022-2031 (US$ Million)
Table 13 Europe Adhesion Barrier Market Value, By Product, 2023, 2027& 2031 (US$ Million)
Table 14 Europe Adhesion Barrier Market Value, By Formulation, 2023, 2027& 2031 (US$ Million)
Table 15 Europe Adhesion Barrier Market Value, By Application, 2023, 2027& 2031 (US$ Million)
Table 16 Europe Adhesion Barrier Market Value, By Country, 2022-2031 (US$ Million)
Table 17 Asia Pacific Adhesion Barrier Market Value, By Product, 2023, 2027& 2031 (US$ Million)
Table 18 Asia Pacific Adhesion Barrier Market Value, By Formulation, 2023, 2027& 2031 (US$ Million)
Table 19 Asia Pacific Adhesion Barrier Market Value, By Application, 2023, 2027& 2031 (US$ Million)
Table 20 Asia Pacific Adhesion Barrier Market Value, By Country, 2023, 2027& 2031 (US$ Million)
Table 21 The Middle East & Africa Adhesion Barrier Market Value, By Product, 2023, 2027& 2031 (US$ Million)
Table 22 The Middle East & Africa Adhesion Barrier Market Value, By Formulation, 2023, 2027& 2031 (US$ Million)
Table 23
Table 24 The Middle East & Africa Adhesion Barrier Market Value, By Application, 2023, 2027& 2031 (US$ Million)
Table 25 The Middle East & Africa Adhesion Barrier Market Value, By Country, 2023, 2027& 2031 (US$ Million)
Table 26 Baxter International: Overview
Table 27 Baxter International: Product Portfolio
Table 28 Baxter International: Key Developments
Table 29 Johnson & Johnson Services, Inc.: Overview
Table 30 Johnson & Johnson Services, Inc.: Product Portfolio
Table 31 Johnson & Johnson Services, Inc.: Key Developments
Table 32 Becton, Dickinson, and Company: Overview
Table 33 Becton, Dickinson, and Company: Product Portfolio
Table 34 Becton, Dickinson, and Company: Key Developments
Table 35 Anika Therapeutics: Overview
Table 36 Anika Therapeutics: Product Portfolio
Table 37 Anika Therapeutics: Key Developments
Table 38 Terumo Corporation: Overview
Table 39 Terumo Corporation: Product Portfolio
Table 40 Terumo Corporation: Key Developments
Table 41 W.L. Gore & Associates: Overview
Table 42 W.L. Gore & Associates: Product Portfolio
Table 43 W.L. Gore & Associates: Key Developments
Table 44 BiosCompass: Overview
Table 45 BiosCompass: Product Portfolio
Table 46 BiosCompass: Key Developments
Table 47 AlloSource, Inc.: Overview
Table 48 AlloSource, Inc.: Product Portfolio
Table 49 AlloSource, Inc.: Key Developments
Table 50 CorMatrix Cardiovascular Inc.: Overview
Table 51 CorMatrix Cardiovascular Inc.: Product Portfolio
Table 52 CorMatrix Cardiovascular Inc.: Key Developments
Table 53 Innocoll Holdings Limited: Overview
Table 54 Innocoll Holdings Limited: Product Portfolio
Table 55 Innocoll Holdings Limited: Key Developments
Table 56 Shin Poong Pharm.co., Ltd.: Overview
Table 57 Shin Poong Pharm.co., Ltd.: Product Portfolio
Table 58 Shin Poong Pharm.co., Ltd. .: Key Developments
Table 59 Hangzhou Singclean Medical Products Co., Ltd.: Overview
Table 60 Hangzhou Singclean Medical Products Co., Ltd.: Product Portfolio
Table 61 Hangzhou Singclean Medical Products Co., Ltd. .: Key Developments
Table 62 Shandong Shuangyuan Sealing Technology Co., Ltd.: Overview
Table 63 Shandong Shuangyuan Sealing Technology Co., Ltd.: Product Portfolio
Table 64 Shandong Shuangyuan Sealing Technology Co., Ltd. .: Key Developments
Table 65 Dongguan Kangda (Kungmedi) Medical Technology Co., Ltd.: Overview
Table 66 Dongguan Kangda (Kungmedi) Medical Technology Co., Ltd.: Product Portfolio
Table 67 Dongguan Kangda (Kungmedi) Medical Technology Co., Ltd. .: Key Developments
List of Figures
Figure 1 Global Adhesion Barrier Market Share, By Product, 2022 & 2031 (%)
Figure 2 Global Adhesion Barrier Market Share, By Formulation, 2022 & 2031 (%)
Figure 3 Global Adhesion Barrier Market Share, By Application, 2022 & 2031 (%)
Figure 4 Global Adhesion Barrier Market Share, By Region, 2022 & 2031 (%)
Figure 5 Global Adhesion Barrier Market Value, 2022-2031 (US$ Million)
Figure 6 Global Adhesion Barrier Market Y-o-Y Growth, By Product, 2022-2031 (%)
Figure 7 Synthetic Adhesion Barriers: Global Adhesion Barrier Market Value, 2022-2031 (US$ Million)
Figure 8 Natural Adhesion Barriers: Global Adhesion Barrier Market Value, 2022-2031 (US$ Million)
Figure 9 Global Adhesion Barrier Market Y-o-Y Growth, By Formulation, 2022-2031 (%)
Figure 10 Film Formulation: Global Adhesion Barrier Market Value, 2022-2031 (US$ Million)
Figure 11 Liquid Formulation: Global Adhesion Barrier Market Value, 2022-2031 (US$ Million)
Figure 12 Gel Formulation: Global Adhesion Barrier Market Value, 2022-2031 (US$ Million)
Figure 13 Global Adhesion Barrier Market Y-o-Y Growth, By Application, 2022-2031 (%)
Figure 14 Gynecological Surgeries: Global Adhesion Barrier Market Value, 2022-2031 (US$ Million)
Figure 15 General/Abdominal Surgeries: Global Adhesion Barrier Market Value, 2022-2031 (US$ Million)
Figure 16 Cardiovascular Surgeries: Global Adhesion Barrier Market Value, 2022-2031 (US$ Million)
Figure 17 Neurological Surgeries: Global Adhesion Barrier Market Value, 2022-2031 (US$ Million)
Figure 18 Other Surgeries: Global Adhesion Barrier Market Value, 2022-2031 (US$ Million)
Figure 19 Global Adhesion Barrier Market Y-o-Y Growth, By Region, 2022-2031 (%)
Figure 20 North America Adhesion Barrier Market Value, 2022-2031 (US$ Million)
Figure 21 North America Adhesion Barrier Market Share, By Product, 2022 & 2031 (%)
Figure 22 North America Adhesion Barrier Market Share, By Formulation, 2022 & 2031 (%)
Figure 23 North America Adhesion Barrier Market Share, By Application, 2022 & 2031 (%)
Figure 24 North America Adhesion Barrier Market Share, By Country, 2022 & 2031 (%)
Figure 25 South America Adhesion Barrier Market Value, 2022-2031 (US$ Million)
Figure 26 South America Adhesion Barrier Market Share, By Product, 2022 & 2031 (%)
Figure 27 South America Adhesion Barrier Market Share, By Formulation, 2022 & 2031 (%)
Figure 28 South America Adhesion Barrier Market Share, By Application, 2022 & 2031 (%)
Figure 29 South America Adhesion Barrier Market Share, By Country, 2022 & 2031 (%)
Figure 30 Europe Adhesion Barrier Market Value, 2022-2031 (US$ Million)
Figure 31 Europe Adhesion Barrier Market Share, By Product, 2022 & 2031 (%)
Figure 32 Europe Adhesion Barrier Market Share, By Formulation, 2022 & 2031 (%)
Figure 33 Europe Adhesion Barrier Market Share, By Application, 2022 & 2031 (%)
Figure 34 Europe Adhesion Barrier Market Share, By Country, 2022 & 2031 (%)
Figure 35 Asia-Pacific Adhesion Barrier Market Value, 2022-2031 (US$ Million)
Figure 36 Asia-Pacific Adhesion Barrier Market Share, By Product, 2022 & 2031 (%)
Figure 37 Asia-Pacific Adhesion Barrier Market Share, By Formulation, 2022 & 2031 (%)
Figure 38 Asia-Pacific Adhesion Barrier Market Share, By Application, 2022 & 2031 (%)
Figure 39 Asia-Pacific Adhesion Barrier Market Share, By Country, 2022 & 2031 (%)
Figure 40 The Middle East & Africa Adhesion Barrier Market Value, 2022-2031 (US$ Million)
Figure 41 The Middle East & Africa Adhesion Barrier Market Share, By Product, 2022 & 2031 (%)
Figure 42 The Middle East & Africa Adhesion Barrier Market Share, By Formulation, 2022 & 2031 (%)
Figure 43 The Middle East & Africa Adhesion Barrier Market Share, By Application, 2022 & 2031 (%)
Figure 44 The Middle East & Africa Adhesion Barrier Market Share, By Country, 2022 & 2031 (%)
Figure 45 Baxter International: Financials
Figure 46 Johnson & Johnson Services, Inc.: Financials
Figure 47 Becton, Dickinson, and Company: Financials
Figure 48 Anika Therapeutics: Financials
Figure 49 Terumo Corporation: Financials
Figure 50 W.L. Gore & Associates: Financials
Figure 51 BiosCompass: Financials
Figure 52 AlloSource, Inc.: Financials
Figure 53 CorMatrix Cardiovascular Inc.: Financials
Figure 54 Innocoll Holdings Limited: Financials
Figure 55 Shin Poong Pharm.co., Ltd.: Financials
Figure 56 Hangzhou Singclean Medical Products Co., Ltd.: Financials
Figure 57 Shandong Shuangyuan Sealing Technology Co., Ltd.: Financials
Figure 58 Dongguan Kangda (Kungmedi) Medical Technology Co., Ltd.: Financials
 世界の癒着防止材市場2025-2033 世界の癒着防止材市場規模は、2024年に11億1,270万米ドルに達しました。IMARCグループは、今後、市場規模が2033年までに19億320万米ドルに達し、2025年から2033年にかけて5.84%の年平均成長率(CAGR)を示すと予測しています。これらのフィルムベースの医療用インプラントは、心臓血管、再建、泌尿器科手術における用途の増加が市場の成長を支えています。 癒着防止材市場は、手術件数の増加や術後癒着の抑制ニーズの高まりにより、今後も成長が見込まれています。特に婦人科、心血管、整形外科などの分野で手術が増加しており、癒着による痛みや再手術リスクを低減する目的での導入が進んでいます。…
、用途別、(~2030年)") 癒着防止材市場:エンドユーザー別、製品タイプ別(フィルム、ゲル、パウダー)、用途別、(~2030年) 癒着防止材市場は2024年の8億6,669万ドルから2025年には9億3,362万ドルに成長し、2030年には13億2,000万ドルに達する見通しで、年平均成長率(CAGR)は7.36%と見込まれています。外科手術後の癒着は慢性疼痛や不妊、再手術の原因となるため、低侵襲手術の普及と回復期間の短縮に対する期待の高まりにより、癒着防止材の需要は拡大しています。近年では、生体吸収性ポリマーや抗炎症成分を含む製品、スプレー型や超薄膜タイプなど新しい材料・技術が登場し、複雑な手術環境にも対応できる高性能製品が求められています。 2025年に米国で導入される関税は、特殊ポリマーやバイオ活性成分など輸入原材…
癒着防止材市場:エンドユーザー別、製品タイプ別(フィルム、ゲル、パウダー)、用途別、(~2030年) 癒着防止材市場は2024年の8億6,669万ドルから2025年には9億3,362万ドルに成長し、2030年には13億2,000万ドルに達する見通しで、年平均成長率(CAGR)は7.36%と見込まれています。外科手術後の癒着は慢性疼痛や不妊、再手術の原因となるため、低侵襲手術の普及と回復期間の短縮に対する期待の高まりにより、癒着防止材の需要は拡大しています。近年では、生体吸収性ポリマーや抗炎症成分を含む製品、スプレー型や超薄膜タイプなど新しい材料・技術が登場し、複雑な手術環境にも対応できる高性能製品が求められています。 2025年に米国で導入される関税は、特殊ポリマーやバイオ活性成分など輸入原材… 冷凍ミートボールの世界市場2024 世界の冷凍ミートボール市場は2023年にxxxxx米ドルと算出され、2024年から2030年の予測期間中にxxxxx%のCAGR(年平均成長率)を記録し、2030年にはxxxxx米ドルに達すると予測されています。 北米の冷凍ミートボール市場は2024年から2030年の予測期間中にxxxxx%のCAGRで2023年のxxxxx米ドルから2030年にはxxxxx米ドルに達すると推定されます。 冷凍ミートボールのアジア太平洋市場は2024年から2030年の予測期間中にxxxxx%のCAGRで2023年のxxxxx米ドルから2030年までにxxxxx米ドルに達すると推定されます。 冷凍ミートボールの主…
- ストローファイバーヒンジ付き容器の世界市場2024:メーカー別、地域別、タイプ・用途別 GlobalInfoResearch社の最新調査によると、世界のストローファイバーヒンジ付き容器市場規模は2023年にxxxx米ドルと評価され、2030年までに年平均xxxx%でxxxx米ドルに成長すると予測されています。 本レポートは、世界のストローファイバーヒンジ付き容器市場に関する詳細かつ包括的な分析です。メーカー別、地域別・国別、タイプ別、用途別の定量分析および定性分析を行っています。市場は絶え間なく変化しているため、本レポートでは競争、需給動向、多くの市場における需要の変化に影響を与える主な要因を調査しています。選定した競合企業の会社概要と製品例、および選定したいくつかのリーダー企業…
- 屋内用ラグの世界市場2024:メーカー別、地域別、タイプ・用途別 GlobalInfoResearch社の最新調査によると、世界の屋内用ラグ市場規模は2023年にxxxx米ドルと評価され、2030年までに年平均xxxx%でxxxx米ドルに成長すると予測されています。 本レポートは、世界の屋内用ラグ市場に関する詳細かつ包括的な分析です。メーカー別、地域別・国別、タイプ別、用途別の定量分析および定性分析を行っています。市場は絶え間なく変化しているため、本レポートでは競争、需給動向、多くの市場における需要の変化に影響を与える主な要因を調査しています。選定した競合企業の会社概要と製品例、および選定したいくつかのリーダー企業の2024年までの市場シェア予測を掲載してい…