 | • レポートコード:IMA3303RW109 • 出版社/出版日:IMARC / 2025年3月 • レポート形態:英語、PDF、約100ページ • 納品方法:Eメール(納期:2日) • 産業分類:材料 |
| Single User | ¥455,848 (USD2,999) | ▷ お問い合わせ |
| Corporate User | ¥759,848 (USD4,999) | ▷ お問い合わせ |
• お支払方法:銀行振込(納品後、ご請求書送付)
レポート概要
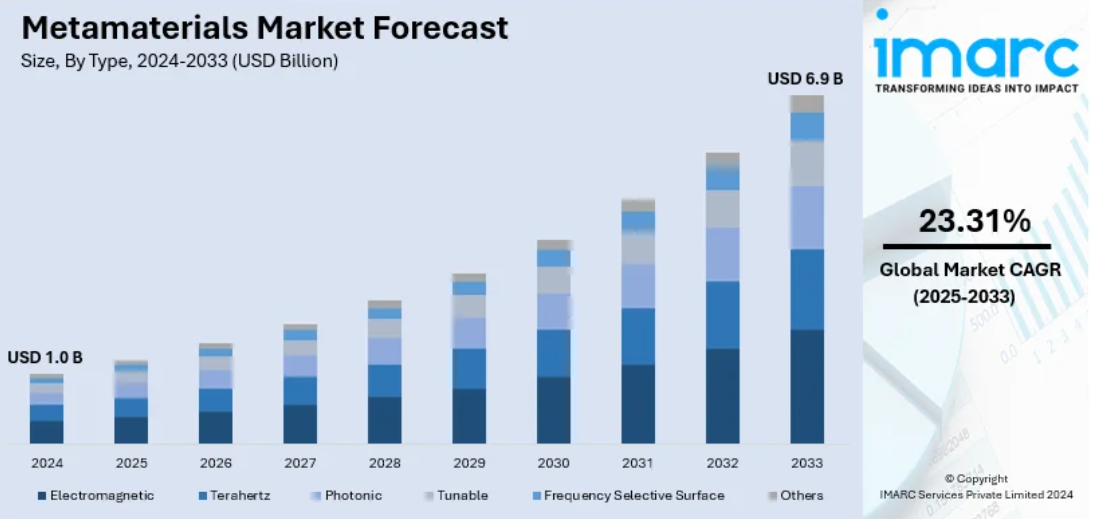
| 世界のメタマテリアル市場は2024年に10億米ドル規模で、2033年には69億米ドルに達すると予測され、2025~2033年の年平均成長率は23.31%と非常に高い成長が見込まれている。2024年時点で北米が42.2%超のシェアを占め、最大市場として業界を牽引している。市場成長の主因はナノテクノロジーやフォトニクスの技術革新、通信・防衛分野での需要増大、医療・再生可能エネルギーでの応用拡大、研究教育分野での取り組み、産業別カスタマイズ可能性の高さなどである。 メタマテリアルは電磁波操作能力の高さから通信、航空宇宙、防衛分野で急速に採用が進み、5G、レーダー、ステルス技術の進展を支えている。2024年9月にはグラスゴー大学が線偏波を円偏波に変換する0.64mm厚の2Dメタマテリアルを発表し、衛星通信やデータ信頼性の向上が期待されている。政府・民間によるR&D投資も増加し、医用画像診断、ウェアラブル、再エネ用途など多様な分野への展開が進む。米国市場では5Gインフラやレーダー需要、衛星通信投資が成長要因で、MITは音響メタマテリアルによる超音波制御技術を開発、医療・通信への応用を拡大している。再エネ分野では太陽光発電効率向上にも貢献し、産業横断的な重要性を高めている。 タイプ別では電磁メタマテリアルが約36.4%で最大セグメントを占め、マイクロ波や光の制御、光学レンズやクローク装置、通信システムに広く応用される。用途別ではアンテナ・レーダー分野が43.9%でトップで、より小型・広帯域・高効率な設計を可能にし、防衛・通信・航空宇宙分野の需要増に対応している。エンドユーザー別では航空宇宙・防衛が約29.7%で最大で、ステルス技術やレーダー断面低減など現代防衛戦略に不可欠な要素となっている。 地域別では北米がR&D投資と技術基盤の強さで優位を保ち、米国が市場の約89%を占める。欧州はエコ技術や医療分野での採用が進み、スマートシティや持続可能建築への応用も拡大中。アジア太平洋では半導体産業の成長と5G需要、EV開発が市場を押し上げており、中国は2030年までに世界半導体市場の成長の60%を担う見込み。南米ではブラジルを中心に再エネ分野、農業の精密化技術で需要が増加。中東・アフリカでは通信・防衛・スマートシティ開発が牽引している。 競争環境では各社がR&D強化、大学や研究機関との提携、M&Aや新拠点設立で新市場開拓を進めている。最新動向としてBASFによるフォトニック結晶メタマテリアル企業への出資、SamsungとMetalenzの協業による顔認証技術強化、Fractal Antennaのステルス検出技術特許、TeraViewの次世代IC検査装置発表、MetaShieldの防汚コーティング特許取得などがあり、用途と技術の多様化が進展している。 |
The global metamaterials market size was valued at USD 1.0 Billion in 2024. Looking forward, IMARC Group estimates the market to reach USD 6.9 Billion by 2033, exhibiting a CAGR of 23.31% from 2025-2033. North America currently dominates the market, holding a market share of over 42.2% in 2024. The market is primarily driven by technological advancements in nanotechnology and photonics, increasing demand in wireless communication and defense sectors, expanding applications in healthcare and sustainable solutions, educational and research initiatives, and customization potential across various industries.
The metamaterials market is expanding due to increasing demand in telecommunications, aerospace, and defense. Their increasing ability to manipulate electromagnetic waves is driving advancements in technologies like 5G, radar, and stealth systems. On September 9, 2024, University of Glasgow engineers unveiled a 0.64mm-thick 2D metamaterial that converts linear to circular polarization, enhancing satellite communication and data reliability across Ku-, K-, and Ka-bands. Rising investments in research and development (R&D), supported by government and private funding, fuel continuous innovation. Additionally, their growing adoption in medical imaging, wearable devices, and renewable energy projects highlights their versatility. Moreover, lightweight, high-performance metamaterials are addressing complex technological challenges, solidifying their importance across diverse industries.
The United States is a key regional market and is expanding due to advancements in telecommunications, aerospace, and healthcare sectors. Demand for high-performance materials in 5G infrastructure, radar, and stealth technology drives growth, alongside rising investments in satellite communication. Metamaterials’ applications in medical imaging, such as MRI enhancements, further augment healthcare innovation. On November 20, 2024, MIT researchers advanced ultrasound wave control in microscale acoustic metamaterials, enabling devices like acoustic demultiplexers for medical and communication uses. Their framework links geometry to material properties, improving fabrication methods. Additionally, metamaterials play a growing role in renewable energy solutions, enhancing solar panel efficiency and energy harvesting. These developments, supported by government and industry collaboration, solidify the United States’ leadership in metamaterial innovation.
Metamaterials Industry Segmentation:
IMARC Group provides an analysis of the key trends in each segment of the global metamaterials market, along with forecast at the global, regional, and country levels from 2025-2033. The market has been categorized based on type, application, and end user.
Analysis by Type:
Electromagnetic
Terahertz
Photonic
Tunable
Frequency Selective Surface
Others
Analysis by Application:
Antenna and Radar
Cloaking Devices
Super Lens
Others
Analysis by End User:
Aerospace and Defense
Medical
Automotive
Consumer Electronics
Energy and Power
Others
Regional Analysis:
North America
United States
Canada
Asia-Pacific
China
Japan
India
South Korea
Australia
Indonesia
Others
Europe
Germany
France
United Kingdom
Italy
Spain
Russia
Others
Latin America
Brazil
Mexico
Others
Middle East and Africa
1 Preface
2 Scope and Methodology
2.1 Objectives of the Study
2.2 Stakeholders
2.3 Data Sources
2.3.1 Primary Sources
2.3.2 Secondary Sources
2.4 Market Estimation
2.4.1 Bottom-Up Approach
2.4.2 Top-Down Approach
2.5 Forecasting Methodology
3 Executive Summary
4 Introduction
4.1 Overview
4.2 Key Industry Trends
5 Global Metamaterials Market
5.1 Market Overview
5.2 Market Performance
5.3 Impact of COVID-19
5.4 Market Forecast
6 Market Breakup by Type
6.1 Electromagnetic
6.1.1 Market Trends
6.1.2 Market Forecast
6.2 Terahertz
6.2.1 Market Trends
6.2.2 Market Forecast
6.3 Photonic
6.3.1 Market Trends
6.3.2 Market Forecast
6.4 Tunable
6.4.1 Market Trends
6.4.2 Market Forecast
6.5 Frequency Selective Surface
6.5.1 Market Trends
6.5.2 Market Forecast
6.6 Others
6.6.1 Market Trends
6.6.2 Market Forecast
7 Market Breakup by Application
7.1 Absorber
7.1.1 Market Trends
7.1.2 Market Forecast
7.2 Antenna and Radar
7.2.1 Market Trends
7.2.2 Market Forecast
7.3 Cloaking Devices
7.3.1 Market Trends
7.3.2 Market Forecast
7.4 Super Lens
7.4.1 Market Trends
7.4.2 Market Forecast
7.5 Others
7.5.1 Market Trends
7.5.2 Market Forecast
8 Market Breakup by End User
8.1 Aerospace and Defense
8.1.1 Market Trends
8.1.2 Market Forecast
8.2 Medical
8.2.1 Market Trends
8.2.2 Market Forecast
8.3 Automotive
8.3.1 Market Trends
8.3.2 Market Forecast
8.4 Consumer Electronics
8.4.1 Market Trends
8.4.2 Market Forecast
8.5 Energy and Power
8.5.1 Market Trends
8.5.2 Market Forecast
8.6 Others
8.6.1 Market Trends
8.6.2 Market Forecast
9 Market Breakup by Region
9.1 North America
9.1.1 United States
9.1.1.1 Market Trends
9.1.1.2 Market Forecast
9.1.2 Canada
9.1.2.1 Market Trends
9.1.2.2 Market Forecast
9.2 Asia-Pacific
9.2.1 China
9.2.1.1 Market Trends
9.2.1.2 Market Forecast
9.2.2 Japan
9.2.2.1 Market Trends
9.2.2.2 Market Forecast
9.2.3 India
9.2.3.1 Market Trends
9.2.3.2 Market Forecast
9.2.4 South Korea
9.2.4.1 Market Trends
9.2.4.2 Market Forecast
9.2.5 Australia
9.2.5.1 Market Trends
9.2.5.2 Market Forecast
9.2.6 Indonesia
9.2.6.1 Market Trends
9.2.6.2 Market Forecast
9.2.7 Others
9.2.7.1 Market Trends
9.2.7.2 Market Forecast
9.3 Europe
9.3.1 Germany
9.3.1.1 Market Trends
9.3.1.2 Market Forecast
9.3.2 France
9.3.2.1 Market Trends
9.3.2.2 Market Forecast
9.3.3 United Kingdom
9.3.3.1 Market Trends
9.3.3.2 Market Forecast
9.3.4 Italy
9.3.4.1 Market Trends
9.3.4.2 Market Forecast
9.3.5 Spain
9.3.5.1 Market Trends
9.3.5.2 Market Forecast
9.3.6 Russia
9.3.6.1 Market Trends
9.3.6.2 Market Forecast
9.3.7 Others
9.3.7.1 Market Trends
9.3.7.2 Market Forecast
9.4 Latin America
9.4.1 Brazil
9.4.1.1 Market Trends
9.4.1.2 Market Forecast
9.4.2 Mexico
9.4.2.1 Market Trends
9.4.2.2 Market Forecast
9.4.3 Others
9.4.3.1 Market Trends
9.4.3.2 Market Forecast
9.5 Middle East and Africa
9.5.1 Market Trends
9.5.2 Market Breakup by Country
9.5.3 Market Forecast
10 SWOT Analysis
10.1 Overview
10.2 Strengths
10.3 Weaknesses
10.4 Opportunities
10.5 Threats
11 Value Chain Analysis
12 Porters Five Forces Analysis
12.1 Overview
12.2 Bargaining Power of Buyers
12.3 Bargaining Power of Suppliers
12.4 Degree of Competition
12.5 Threat of New Entrants
12.6 Threat of Substitutes
13 Price Analysis
14 Competitive Landscape
14.1 Market Structure
14.2 Key Players
14.3 Profiles of Key Players
14.3.1 Acoustic Metamaterials Group Ltd
14.3.1.1 Company Overview
14.3.1.2 Product Portfolio
14.3.2 Echodyne Corp
14.3.2.1 Company Overview
14.3.2.2 Product Portfolio
14.3.3 Fractal Antenna Systems Inc.
14.3.3.1 Company Overview
14.3.3.2 Product Portfolio
14.3.4 JEM Engineering LLC
14.3.4.1 Company Overview
14.3.4.2 Product Portfolio
14.3.5 Kymeta Corporation
14.3.5.1 Company Overview
14.3.5.2 Product Portfolio
14.3.6 Metamagnetics Inc
14.3.6.1 Company Overview
14.3.6.2 Product Portfolio
14.3.7 Metamaterial Technologies Inc.
14.3.7.1 Company Overview
14.3.7.2 Product Portfolio
14.3.8 MetaShield LLC
14.3.8.1 Company Overview
14.3.8.2 Product Portfolio
14.3.9 Nanoscribe GmbH & Co. KG (Cellink AB)
14.3.9.1 Company Overview
14.3.9.2 Product Portfolio
14.3.10 Plasmonics Inc.
14.3.10.1 Company Overview
14.3.10.2 Product Portfolio
14.3.11 TeraView Limited
14.3.11.1 Company Overview
14.3.11.2 Product Portfolio
List of Figures
Figure 1: Global: Metamaterials Market: Major Drivers and Challenges
Figure 2: Global: Metamaterials Market: Sales Value (in Billion USD), 2019-2024
Figure 3: Global: Metamaterials Market Forecast: Sales Value (in Billion USD), 2025-2033
Figure 4: Global: Metamaterials Market: Breakup by Type (in %), 2024
Figure 5: Global: Metamaterials Market: Breakup by Application (in %), 2024
Figure 6: Global: Metamaterials Market: Breakup by End User (in %), 2024
Figure 7: Global: Metamaterials Market: Breakup by Region (in %), 2024
Figure 8: Global: Metamaterials (Electromagnetic) Market: Sales Value (in Million USD), 2019 & 2024
Figure 9: Global: Metamaterials (Electromagnetic) Market Forecast: Sales Value (in Million USD), 2025-2033
Figure 10: Global: Metamaterials (Terahertz) Market: Sales Value (in Million USD), 2019 & 2024
Figure 11: Global: Metamaterials (Terahertz) Market Forecast: Sales Value (in Million USD), 2025-2033
Figure 12: Global: Metamaterials (Photonic) Market: Sales Value (in Million USD), 2019 & 2024
Figure 13: Global: Metamaterials (Photonic) Market Forecast: Sales Value (in Million USD), 2025-2033
Figure 14: Global: Metamaterials (Tunable) Market: Sales Value (in Million USD), 2019 & 2024
Figure 15: Global: Metamaterials (Tunable) Market Forecast: Sales Value (in Million USD), 2025-2033
Figure 16: Global: Metamaterials (Frequency Selective Surface) Market: Sales Value (in Million USD), 2019 & 2024
Figure 17: Global: Metamaterials (Frequency Selective Surface) Market Forecast: Sales Value (in Million USD), 2025-2033
Figure 18: Global: Metamaterials (Other Types) Market: Sales Value (in Million USD), 2019 & 2024
Figure 19: Global: Metamaterials (Other Types) Market Forecast: Sales Value (in Million USD), 2025-2033
Figure 20: Global: Metamaterials (Absorber) Market: Sales Value (in Million USD), 2019 & 2024
Figure 21: Global: Metamaterials (Absorber) Market Forecast: Sales Value (in Million USD), 2025-2033
Figure 22: Global: Metamaterials (Antenna and Radar) Market: Sales Value (in Million USD), 2019 & 2024
Figure 23: Global: Metamaterials (Antenna and Radar) Market Forecast: Sales Value (in Million USD), 2025-2033
Figure 24: Global: Metamaterials (Cloaking Devices) Market: Sales Value (in Million USD), 2019 & 2024
Figure 25: Global: Metamaterials (Cloaking Devices) Market Forecast: Sales Value (in Million USD), 2025-2033
Figure 26: Global: Metamaterials (Super Lens) Market: Sales Value (in Million USD), 2019 & 2024
Figure 27: Global: Metamaterials (Super Lens) Market Forecast: Sales Value (in Million USD), 2025-2033
Figure 28: Global: Metamaterials (Other Applications) Market: Sales Value (in Million USD), 2019 & 2024
Figure 29: Global: Metamaterials (Other Applications) Market Forecast: Sales Value (in Million USD), 2025-2033
Figure 30: Global: Metamaterials (Aerospace and Defense) Market: Sales Value (in Million USD), 2019 & 2024
Figure 31: Global: Metamaterials (Aerospace and Defense) Market Forecast: Sales Value (in Million USD), 2025-2033
Figure 32: Global: Metamaterials (Medical) Market: Sales Value (in Million USD), 2019 & 2024
Figure 33: Global: Metamaterials (Medical) Market Forecast: Sales Value (in Million USD), 2025-2033
Figure 34: Global: Metamaterials (Automotive) Market: Sales Value (in Million USD), 2019 & 2024
Figure 35: Global: Metamaterials (Automotive) Market Forecast: Sales Value (in Million USD), 2025-2033
Figure 36: Global: Metamaterials (Consumer Electronics) Market: Sales Value (in Million USD), 2019 & 2024
Figure 37: Global: Metamaterials (Consumer Electronics) Market Forecast: Sales Value (in Million USD), 2025-2033
Figure 38: Global: Metamaterials (Energy and Power) Market: Sales Value (in Million USD), 2019 & 2024
Figure 39: Global: Metamaterials (Energy and Power) Market Forecast: Sales Value (in Million USD), 2025-2033
Figure 40: Global: Metamaterials (Other End Users) Market: Sales Value (in Million USD), 2019 & 2024
Figure 41: Global: Metamaterials (Other End Users) Market Forecast: Sales Value (in Million USD), 2025-2033
Figure 42: North America: Metamaterials Market: Sales Value (in Million USD), 2019 & 2024
Figure 43: North America: Metamaterials Market Forecast: Sales Value (in Million USD), 2025-2033
Figure 44: United States: Metamaterials Market: Sales Value (in Million USD), 2019 & 2024
Figure 45: United States: Metamaterials Market Forecast: Sales Value (in Million USD), 2025-2033
Figure 46: Canada: Metamaterials Market: Sales Value (in Million USD), 2019 & 2024
Figure 47: Canada: Metamaterials Market Forecast: Sales Value (in Million USD), 2025-2033
Figure 48: Asia-Pacific: Metamaterials Market: Sales Value (in Million USD), 2019 & 2024
Figure 49: Asia-Pacific: Metamaterials Market Forecast: Sales Value (in Million USD), 2025-2033
Figure 50: China: Metamaterials Market: Sales Value (in Million USD), 2019 & 2024
Figure 51: China: Metamaterials Market Forecast: Sales Value (in Million USD), 2025-2033
Figure 52: Japan: Metamaterials Market: Sales Value (in Million USD), 2019 & 2024
Figure 53: Japan: Metamaterials Market Forecast: Sales Value (in Million USD), 2025-2033
Figure 54: India: Metamaterials Market: Sales Value (in Million USD), 2019 & 2024
Figure 55: India: Metamaterials Market Forecast: Sales Value (in Million USD), 2025-2033
Figure 56: South Korea: Metamaterials Market: Sales Value (in Million USD), 2019 & 2024
Figure 57: South Korea: Metamaterials Market Forecast: Sales Value (in Million USD), 2025-2033
Figure 58: Australia: Metamaterials Market: Sales Value (in Million USD), 2019 & 2024
Figure 59: Australia: Metamaterials Market Forecast: Sales Value (in Million USD), 2025-2033
Figure 60: Indonesia: Metamaterials Market: Sales Value (in Million USD), 2019 & 2024
Figure 61: Indonesia: Metamaterials Market Forecast: Sales Value (in Million USD), 2025-2033
Figure 62: Others: Metamaterials Market: Sales Value (in Million USD), 2019 & 2024
Figure 63: Others: Metamaterials Market Forecast: Sales Value (in Million USD), 2025-2033
Figure 64: Europe: Metamaterials Market: Sales Value (in Million USD), 2019 & 2024
Figure 65: Europe: Metamaterials Market Forecast: Sales Value (in Million USD), 2025-2033
Figure 66: Germany: Metamaterials Market: Sales Value (in Million USD), 2019 & 2024
Figure 67: Germany: Metamaterials Market Forecast: Sales Value (in Million USD), 2025-2033
Figure 68: France: Metamaterials Market: Sales Value (in Million USD), 2019 & 2024
Figure 69: France: Metamaterials Market Forecast: Sales Value (in Million USD), 2025-2033
Figure 70: United Kingdom: Metamaterials Market: Sales Value (in Million USD), 2019 & 2024
Figure 71: United Kingdom: Metamaterials Market Forecast: Sales Value (in Million USD), 2025-2033
Figure 72: Italy: Metamaterials Market: Sales Value (in Million USD), 2019 & 2024
Figure 73: Italy: Metamaterials Market Forecast: Sales Value (in Million USD), 2025-2033
Figure 74: Spain: Metamaterials Market: Sales Value (in Million USD), 2019 & 2024
Figure 75: Spain: Metamaterials Market Forecast: Sales Value (in Million USD), 2025-2033
Figure 76: Russia: Metamaterials Market: Sales Value (in Million USD), 2019 & 2024
Figure 77: Russia: Metamaterials Market Forecast: Sales Value (in Million USD), 2025-2033
Figure 78: Others: Metamaterials Market: Sales Value (in Million USD), 2019 & 2024
Figure 79: Others: Metamaterials Market Forecast: Sales Value (in Million USD), 2025-2033
Figure 80: Latin America: Metamaterials Market: Sales Value (in Million USD), 2019 & 2024
Figure 81: Latin America: Metamaterials Market Forecast: Sales Value (in Million USD), 2025-2033
Figure 82: Brazil: Metamaterials Market: Sales Value (in Million USD), 2019 & 2024
Figure 83: Brazil: Metamaterials Market Forecast: Sales Value (in Million USD), 2025-2033
Figure 84: Mexico: Metamaterials Market: Sales Value (in Million USD), 2019 & 2024
Figure 85: Mexico: Metamaterials Market Forecast: Sales Value (in Million USD), 2025-2033
Figure 86: Others: Metamaterials Market: Sales Value (in Million USD), 2019 & 2024
Figure 87: Others: Metamaterials Market Forecast: Sales Value (in Million USD), 2025-2033
Figure 88: Middle East and Africa: Metamaterials Market: Sales Value (in Million USD), 2019 & 2024
Figure 89: Middle East and Africa: Metamaterials Market: Breakup by Country (in %), 2024
Figure 90: Middle East and Africa: Metamaterials Market Forecast: Sales Value (in Million USD), 2025-2033
Figure 91: Global: Metamaterials Industry: SWOT Analysis
Figure 92: Global: Metamaterials Industry: Value Chain Analysis
Figure 93: Global: Metamaterials Industry: Porter’s Five Forces Analysis
List of Tables
Table 1: Global: Metamaterials Market: Key Industry Highlights, 2024 and 2033
Table 2: Global: Metamaterials Market Forecast: Breakup by Type (in Million USD), 2025-2033
Table 3: Global: Metamaterials Market Forecast: Breakup by Application (in Million USD), 2025-2033
Table 4: Global: Metamaterials Market Forecast: Breakup by End User (in Million USD), 2025-2033
Table 5: Global: Metamaterials Market Forecast: Breakup by Region (in Million USD), 2025-2033
Table 6: Global: Metamaterials Market: Competitive Structure
Table 7: Global: Metamaterials Market: Key Players
 エアロデリバティブガスタービンの世界市場2025 The global aeroderivative gas turbine market size reached USD 3.6 Billion in 2024. Looking forward, IMARC Group expects the market to reach USD 5.6 Billion by 2033, exhibiting a growth rate (CAGR) of 4.7% during 2025-2033. The widespread adoption of aeroderivative gas turbines across oil and gas ind…
 世界の癒着防止材市場2025-2033 世界の癒着防止材市場規模は、2024年に11億1,270万米ドルに達しました。IMARCグループは、今後、市場規模が2033年までに19億320万米ドルに達し、2025年から2033年にかけて5.84%の年平均成長率(CAGR)を示すと予測しています。これらのフィルムベースの医療用インプラントは、心臓血管、再建、泌尿器科手術における用途の増加が市場の成長を支えています。 癒着防止材市場は、手術件数の増加や術後癒着の抑制ニーズの高まりにより、今後も成長が見込まれています。特に婦人科、心血管、整形外科などの分野で手術が増加しており、癒着による痛みや再手術リスクを低減する目的での導入が進んでいます。…
市場 2024-2031") 世界の光学的透明接着剤(OCA)市場 2024-2031 Optically clear adhesives (OCA) are transparent and uncoloured adhesives that allow bonding of the entire surface area of a screen to the devices without any distortion display. The optical clarity is an important aspect of these adhesives as it is clean & high in transparency hence used in most cri…
世界の光学的透明接着剤(OCA)市場 2024-2031 Optically clear adhesives (OCA) are transparent and uncoloured adhesives that allow bonding of the entire surface area of a screen to the devices without any distortion display. The optical clarity is an important aspect of these adhesives as it is clean & high in transparency hence used in most cri…- 世界の光学的透明接着剤(OCA)市場2025-2031 The global Optically Clear Adhesive market size was US$ 1360 million in 2024 and is forecast to a readjusted size of US$ 1892 million by 2031 with a CAGR of 4.9% during the forecast period 2025-2031. The North America Optically Clear Adhesive market size was US$ million in 2024, while Europe was US$…
- 世界の自動車用高電圧ワイヤーハーネス市場 – 2030年 Introduction to the High-Voltage Automotive Wire Harness Market Overview The high-voltage automotive wire harness market underpins the rapid transformation of the global automotive industry. As original equipment manufacturers and tier-one suppliers pursue electrification, advanced driver assistance…