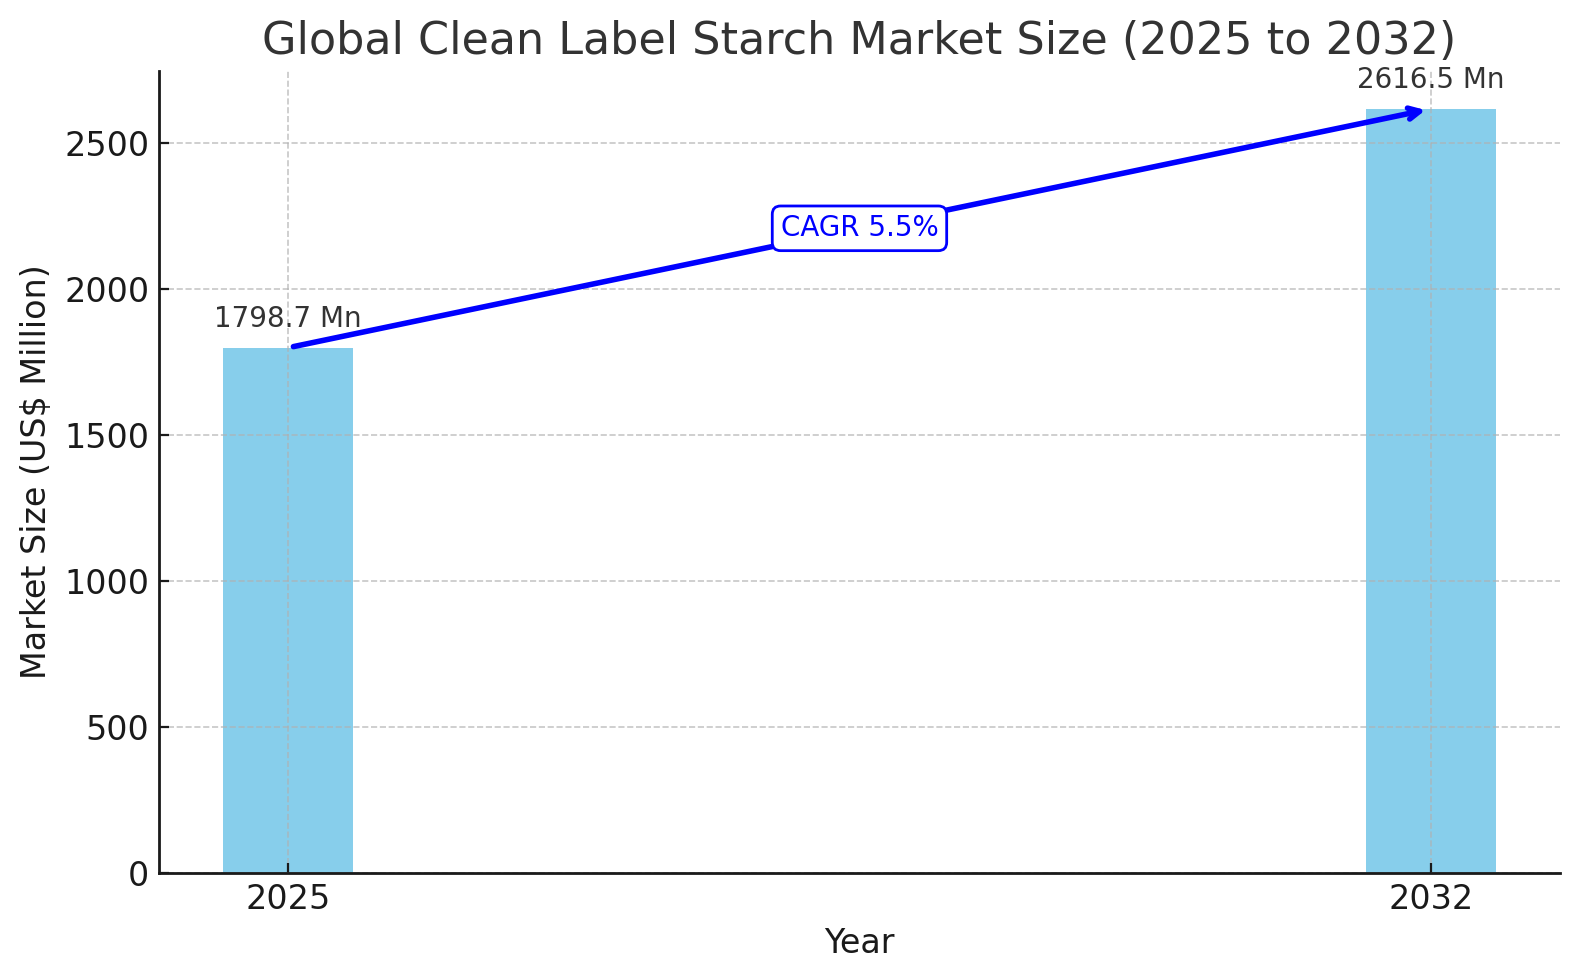
The global clean label starch market is poised to expand steadily over the forecast period. In 2025, the market is estimated to reach a value of USD 1,798.7 million, and it is projected to grow at a compound annual growth rate (CAGR) of 5.5%, reaching approximately USD 2,616.5 million by 2032. This growth is being driven by evolving consumer preferences, an increasing demand for natural and plant-based ingredients, and heightened awareness of food labeling transparency.
From 2019 to 2024, the market experienced moderate growth at a CAGR of 3.8%, reaching a value of approximately USD 1,732.9 million by 2024. Rising demand for clean-label functional food additives and a shift away from artificial and synthetic components have played a key role in this growth. Consumers across regions are placing a stronger emphasis on wellness and transparency, often prioritizing ingredient labels over brand loyalty. This behavior has created opportunities for manufacturers to innovate and diversify their product offerings using label-friendly starches derived from corn, potato, tapioca, and other natural sources.
Food manufacturers are responding to these preferences by reformulating existing products and introducing new ones that align with clean label standards. As urbanization increases and lifestyles become busier, particularly in developing regions, the need for convenient, processed, and ready-to-eat foods continues to grow. Clean label starch is now a critical component in such products due to its ability to deliver desirable texture and stability without compromising health or ingredient clarity.
One of the most significant trends in the market is the increasing demand for natural, plant-based ingredients. Consumers are increasingly concerned about the long-term impact of artificial additives and are seeking out healthier options, especially in categories like soups, sauces, dairy, and baked goods. Clean label starches are playing a vital role in this transition by acting as thickeners, stabilizers, and binding agents in these applications.
In 2024, soups and sauces accounted for the largest application segment, contributing to 44% of clean label starch use. The health benefits associated with starches like corn and tapioca—such as improved blood glucose control, cardiovascular support, and gut health—are driving this demand. Clean label starches are also suitable for low pH and high-shear processing environments, making them particularly useful in industrial food production.
The food additive industry’s rapid evolution is another key growth driver. Consumers, especially younger demographics, are more inclined toward natural and ethical ingredients. As the industry moves away from synthetic additives, demand for starches with clean label certifications continues to rise. These starches also contribute to longer shelf life and improved quality in a variety of processed foods including meat, desserts, and dairy products.
The market is highly dynamic, with companies implementing strategies to expand product visibility across regions. Many manufacturers are investing in innovation and regional partnerships to strengthen their positions. For example, in January 2020, AGRANA Beteiligungs-AG acquired Marroquin Organic International to bolster its starch distribution capabilities. Similarly, Archer Daniels Midland Company formed a strategic alliance with Thailand-based General Starch Limited to expand access to tapioca starch in the Asia-Pacific region.
Europe remains one of the most significant markets for clean label starch, with the United Kingdom accounting for 14.9% of regional market share in 2024. The demand in Europe is largely fueled by the region’s strict food regulations and consumer inclination toward clean and functional additives that enhance taste and texture without artificial elements.
India is emerging as a key market in Asia, with clean label starch demand valued at USD 111.2 million in 2024. The Indian market is expected to grow at a volume CAGR of 8.8% during the forecast period, driven by increasing awareness of chemical-free ingredients and rising health consciousness among consumers.
By source, corn starch dominates the global clean label starch market with a 52.2% share. This is primarily attributed to its compatibility with various food products and its popularity among consumers who are adopting healthier diets. Wheat, potato, tapioca, rice, and pea starches also account for significant shares in global usage, with applications ranging from snacks and bakery products to beverages and infant formulas.
In addition to food, clean label starch is gaining traction in the pharmaceutical industry. The market value of clean label starch in this segment is projected to reach USD 114.5 million by 2032. It is being increasingly utilized in medicine formulation, offering health benefits and improved digestibility. Consumers are also leaning toward fiber-rich, low-fat meals, which enhances the demand for clean starches in therapeutic and nutritional applications.
Leading companies are actively investing in product development and infrastructure to meet growing global demand. AGRANA Beteiligungs-AG invested over USD 34.4 million in its Austrian plant to scale up potato and corn starch production. Ingredion Incorporated introduced NOVATION 3620 and 3820 for beverages, while Tate & Lyle added new formulations suited for frozen meals, sauces, and yogurts. Roquette Frères S.A launched Lycagel, a pea-based alternative to gelatin for softgel capsules, expanding the clean label concept into pharmaceutical and nutraceutical applications.
The competitive landscape includes major global players such as Ingredion Incorporated, Cargill, Tate & Lyle, ADM, AGRANA, Roquette, BENEO, and Avebe. These companies are focused on R&D, sustainability, and strategic expansion into high-growth markets such as South Asia, East Asia, and the Middle East. Innovation and local partnerships are key themes in this evolving sector.
Overall, the clean label starch market is expected to continue growing as consumer preferences shift toward transparency, health-conscious diets, and sustainable sourcing. Manufacturers that prioritize product integrity and align with clean label standards are well-positioned to benefit from this global movement toward better food and health.
Clean Label Starch Industry Research by Category
By Source:
- Corn
- Wheat
- Potato
- Tapioca
- Rice & Pea
By Form:
- Powder
- Liquid
By Application:
- Food Industry
- Dairy Products
- Bakery
- Soups, Sauces & Dressings
- Infant Formula
- Convenience Foods
- Snacks & Confectionery
- Beverages
- Others
- Animal Feed Industry
- Pharmaceutical
- Others
By Region:
- North America
- Latin America
- Europe
- South Asia & Pacific
- East Asia
- Middle East & Africa
1. Executive Summary
1.1. Global Market Outlook
1.2. Demand Side Trends
1.3. Supply Side Trends
1.4. Technology Roadmap
1.5. Analysis and Recommendations
2. Market Overview
2.1. Market Coverage / Taxonomy
2.2. Market Definition / Scope / Limitations
3. Key Market Trends
3.1. Key Trends Impacting the Market
3.2. Product Innovation / Development Trends
4. Key Success Factors
4.1. Product Adoption / Usage Analysis
4.2. Product USPs / Features
4.3. Product Differentiation and Brand’s Strategy Analysis
5. Global Clean Label Starch Market Demand Analysis 2019-2032
5.1. Historical Market Volume (Tons) Analysis, 2019-2023
5.2. Current and Future Market Volume (Tons) Projections, 2024-2032
5.3. Y-o-Y Growth Trend Analysis
6. Global Clean Label Starch Market – Pricing Analysis
6.1. Regional Pricing Trend Analysis
6.2. Global Average Pricing Analysis Benchmark
7. Global Clean Label Starch Market Demand (in Value or Size in US$ Mn) Analysis 2019-2032
7.1. Historical Market Value (US$ Mn) Analysis, 2019-2023
7.2. Current and Future Market Value (US$ Mn) Projections, 2024-2032
7.2.1. Y-o-Y Growth Trend Analysis
7.2.2. Absolute $ Opportunity Analysis
8. Market Background
8.1. Macro-Economic Factors
8.1.1. Global GDP Growth Outlook
8.1.2. Global Food Industry Overview
8.1.3. Global GDP and Infrastructure Investment
8.1.4. International Trade
8.1.5. Global Industry Outlook
8.2. Forecast Factors – Relevance & Impact
8.2.1. Top Companies Historical Growth
8.2.2. GDP Growth forecast
8.2.3. Manufacturing Industry forecast
8.2.4. Business Climate
8.3. Value Chain
8.3.1. Raw Material Suppliers
8.3.2. Product Manufacturers
8.3.3. Applicationrs
8.4. Global Food Industry Outlook
8.5. Market Dynamics
8.5.1. Drivers
8.5.2. Restraints
8.5.3. Opportunity Analysis
8.6. Global Supply Demand Analysis
9. Global Clean Label Starch Market Analysis 2019-2032, By Form
9.1. Introduction / Key Findings
9.2. Historical Market Size (US$ Mn) and Volume Analysis By Form, 2019-2023
9.3. Current and Future Market Size (US$ Mn) and Volume Analysis and Forecast By Form, 2024-2032
9.3.1. Liquid
9.3.2. Powder
9.4. Market Attractiveness Analysis By Form
10. Global Clean Label Starch Market Analysis 2019-2032, by Source
10.1. Introduction / Key Findings
10.2. Historical Market Size (US$ Mn) and Volume Analysis By Source, 2019-2023
10.3. Current and Future Market Size (US$ Mn) and Volume Analysis and Forecast By Source, 2024-2032
10.3.1. Corn
10.3.2. Wheat
10.3.3. Potato
10.3.4. Tapioca
10.3.5. Others
10.4. Market Attractiveness Analysis By Source
11. Global Clean Label Starch Market Analysis 2019-2032, By Application
11.1. Introduction / Key Findings
11.2. Historical Market Size (US$ Mn) and Volume Analysis By Application, 2019-2023
11.3. Current and Future Market Size (US$ Mn) and Volume Analysis and Forecast By Application, 2024-2032
11.3.1. Food & Beverage Industry
11.3.1.1. Dairy Products
11.3.1.2. Bakery & Confectionery
11.3.1.3. Soups, Sauces & Dressings
11.3.1.4. Infant Formula
11.3.1.5. Convenience Foods
11.3.1.6. Savory & Snacks
11.3.1.7. Beverages
11.3.1.8. Others
11.3.2. Animal Feed Industry
11.3.3. Pharmaceutical
11.3.4. Others
11.4. Market Attractiveness Analysis By Application
12. Global Clean Label Starch Market Analysis 2019-2032, by Region
12.1. Introduction
12.2. Historical Market Size (US$ Mn) and Volume Analysis By Region, 2019-2023
12.3. Current Market Size (US$ Mn) and Volume Analysis and Forecast By Region, 2024-2032
12.3.1. North America
12.3.2. Latin America
12.3.3. Europe
12.3.4. East Asia
12.3.5. South Asia and Pacific
12.3.6. Middle East and Africa (MEA)
12.4. Market Attractiveness Analysis By Region
13. North America Clean Label Starch Market Analysis 2019-2032
13.1. Introduction
13.2. Pricing Analysis
13.3. Historical Market Size (US$ Mn) and Volume Trend Analysis By Market Taxonomy, 2019-2023
13.4. Market Size (US$ Mn) and Volume Forecast By Market Taxonomy, 2024-2032
13.4.1. By Country
13.4.1.1. U.S.
13.4.1.2. Canada
13.4.2. By Form
13.4.3. By Source
13.4.4. By Application
13.5. Market Attractiveness Analysis
13.5.1. By Country
13.5.2. By Form
13.5.3. By Source
13.5.4. By Application
13.6. Market Trends
13.7. Key Market Participants – Intensity Mapping
13.8. Drivers and Restraints – Impact Analysis
14. Latin America Clean Label Starch Market Analysis 2019-2032
14.1. Introduction
14.2. Pricing Analysis
14.3. Historical Market Size (US$ Mn) and Volume Trend Analysis By Market Taxonomy, 2019-2023
14.4. Market Size (US$ Mn) and Volume Forecast By Market Taxonomy, 2024-2032
14.4.1. By Country
14.4.1.1. Brazil
14.4.1.2. Mexico
14.4.1.3. Argentina
14.4.1.4. Rest of Latin America
14.4.2. By Form
14.4.3. By Source
14.4.4. By Application
14.5. Market Attractiveness Analysis
14.5.1. By Country
14.5.2. By Form
14.5.3. By Source
14.5.4. By Application
14.6. Market Trends
14.7. Key Market Participants – Intensity Mapping
14.8. Drivers and Restraints – Impact Analysis
15. Europe Clean Label Starch Market Analysis 2019-2032
15.1. Introduction
15.2. Pricing Analysis
15.3. Historical Market Size (US$ Mn) and Volume Trend Analysis By Market Taxonomy, 2019-2023
15.4. Market Size (US$ Mn) and Volume Forecast By Market Taxonomy, 2024-2032
15.4.1. By Country
15.4.1.1. Germany
15.4.1.2. Italy
15.4.1.3. France
15.4.1.4. U.K.
15.4.1.5. Spain
15.4.1.6. BENELUX
15.4.1.7. Nordic
15.4.1.8. Russia
15.4.1.9. Poland
15.4.1.10. Rest of Europe
15.4.2. By Form
15.4.3. By Source
15.4.4. By Application
15.5. Market Attractiveness Analysis
15.5.1. By Country
15.5.2. By Form
15.5.3. By Source
15.5.4. By Application
15.6. Market Trends
15.7. Key Market Participants – Intensity Mapping
15.8. Drivers and Restraints – Impact Analysis
16. South Asia and Pacific Clean Label Starch Market Analysis 2019-2032
16.1. Introduction
16.2. Pricing Analysis
16.3. Historical Market Size (US$ Mn) and Volume Trend Analysis By Market Taxonomy, 2019-2023
16.4. Market Size (US$ Mn) and Volume Forecast By Market Taxonomy, 2024-2032
16.4.1. By Country
16.4.1.1. India
16.4.1.2. ASEAN
16.4.1.3. Oceania (Australia & New Zealand)
16.4.1.4. Rest of South Asia & Pacific
16.4.2. By Form
16.4.3. By Source
16.4.4. By Application
16.5. Market Attractiveness Analysis
16.5.1. By Country
16.5.2. By Form
16.5.3. By Source
16.5.4. By Application
16.6. Market Trends
16.7. Key Market Participants – Intensity Mapping
16.8. Drivers and Restraints – Impact Analysis
17. East Asia Clean Label Starch Market Analysis 2019-2032
17.1. Introduction
17.2. Pricing Analysis
17.3. Historical Market Size (US$ Mn) and Volume Trend Analysis By Market Taxonomy, 2019-2023
17.4. Market Size (US$ Mn) and Volume Forecast By Market Taxonomy, 2024-2032
17.4.1. By Country
17.4.1.1. China
17.4.1.2. Japan
17.4.1.3. South Korea
17.4.2. By Form
17.4.3. By Source
17.4.4. By Application
17.5. Market Attractiveness Analysis
17.5.1. By Country
17.5.2. By Form
17.5.3. By Source
17.5.4. By Application
17.6. Market Trends
17.7. Key Market Participants – Intensity Mapping
17.8. Drivers and Restraints – Impact Analysis
18. Middle East and Africa Clean Label Starch Market Analysis 2019-2032
18.1. Introduction
18.2. Pricing Analysis
18.3. Historical Market Size (US$ Mn) and Volume Trend Analysis By Market Taxonomy, 2019-2023
18.4. Market Size (US$ Mn) and Volume Forecast By Market Taxonomy, 2024-2032
18.4.1. By Country
18.4.1.1. GCC Countries
18.4.1.2. Turkey
18.4.1.3. Northern Africa
18.4.1.4. South Africa
18.4.1.5. Rest of Middle East and Africa
18.4.2. By Form
18.4.3. By Source
18.4.4. By Application
18.5. Market Attractiveness Analysis
18.5.1. By Country
18.5.2. By Form
18.5.3. By Source
18.5.4. By Application
18.6. Market Trends
18.7. Key Market Participants – Intensity Mapping
18.8. Drivers and Restraints – Impact Analysis
19. Country Wise Clean Label Starch Market Analysis, 2024
19.1. Introduction
19.1.1. Market Value Proportion Analysis, By Key Countries
19.1.2. Global Vs. Country Growth Comparison
19.2. U.S. Clean Label Starch Market Analysis
19.2.1. By Form
19.2.2. By Source
19.2.3. By Application
19.3. Canada Clean Label Starch Market Analysis
19.3.1. By Form
19.3.2. By Source
19.3.3. By Application
19.4. Mexico Clean Label Starch Market Analysis
19.4.1. By Form
19.4.2. By Source
19.4.3. By Application
19.5. Brazil Clean Label Starch Market Analysis
19.5.1. By Form
19.5.2. By Source
19.5.3. By Application
19.6. Argentina Clean Label Starch Market Analysis
19.6.1. By Form
19.6.2. By Source
19.6.3. By Application
19.7. Germany Clean Label Starch Market Analysis
19.7.1. By Form
19.7.2. By Source
19.7.3. By Application
19.8. Italy Clean Label Starch Market Analysis
19.8.1. By Form
19.8.2. By Source
19.8.3. By Application
19.9. France Clean Label Starch Market Analysis
19.9.1. By Form
19.9.2. By Source
19.9.3. By Application
19.10. U.K. Clean Label Starch Market Analysis
19.10.1. By Form
19.10.2. By Source
19.10.3. By Application
19.11. Spain Clean Label Starch Market Analysis
19.11.1. By Form
19.11.2. By Source
19.11.3. By Application
19.12. Russia Clean Label Starch Market Analysis
19.12.1. By Grade
19.12.2. By Source
19.12.3. By Source
19.12.4. By Application
19.12.5. By Extract Source
19.13. Poland Clean Label Starch Market Analysis
19.13.1. By Form
19.13.2. By Source
19.13.3. By Application
19.14. China Clean Label Starch Market Analysis
19.14.1. By Form
19.14.2. By Source
19.14.3. By Application
19.15. Japan Clean Label Starch Market Analysis
19.15.1. By Form
19.15.2. By Source
19.15.3. By Application
19.16. S. Korea Clean Label Starch Market Analysis
19.16.1. By Form
19.16.2. By Source
19.16.3. By Application
19.17. India Clean Label Starch Market Analysis
19.17.1. By Form
19.17.2. By Source
19.17.3. By Application
19.18. Turkey Clean Label Starch Market Analysis
19.18.1. By Form
19.18.2. By Source
19.18.3. By Application
19.19. South Africa Clean Label Starch Market Analysis
19.19.1. By Form
19.19.2. By Source
19.19.3. By Application
20. Market Structure Analysis
20.1. Market Analysis by Tier of Companies (Clean Label Starch)
20.2. Market Share Analysis of Top Players
20.3. Market Presence Analysis
21. Competition Analysis
21.1. Competition Dashboard
21.2. Competition Benchmarking
21.3. Competition Deep Dive
21.3.1. Archer Daniels Midland Company
21.3.1.1. Overview
21.3.1.2. Product Portfolio
21.3.1.3. Profitability by Market Segments (Product/Channel/Region)
21.3.1.4. Sales Footprint
21.3.1.5. Strategy Overview
21.3.2. Tate & Lyle
21.3.2.1. Overview
21.3.2.2. Product Portfolio
21.3.2.3. Profitability by Market Segments (Product/Channel/Region)
21.3.2.4. Sales Footprint
21.3.2.5. Strategy Overview
21.3.3. Roquette Frères S.A.
21.3.3.1. Overview
21.3.3.2. Product Portfolio
21.3.3.3. Profitability by Market Segments (Product/Channel/Region)
21.3.3.4. Sales Footprint
21.3.3.5. Strategy Overview
21.3.4. Cargill, Incorporated
21.3.4.1. Overview
21.3.4.2. Product Portfolio
21.3.4.3. Profitability by Market Segments (Product/Channel/Region)
21.3.4.4. Sales Footprint
21.3.4.5. Strategy Overview
21.3.5. BENEO GmbH
21.3.5.1. Overview
21.3.5.2. Product Portfolio
21.3.5.3. Profitability by Market Segments (Product/Channel/Region)
21.3.5.4. Sales Footprint
21.3.5.5. Strategy Overview
21.3.6. Emsland Group
21.3.6.1. Overview
21.3.6.2. Product Portfolio
21.3.6.3. Profitability by Market Segments (Product/Channel/Region)
21.3.6.4. Sales Footprint
21.3.6.5. Strategy Overview
21.3.7. SMS Corporation
21.3.7.1. Overview
21.3.7.2. Product Portfolio
21.3.7.3. Profitability by Market Segments (Product/Channel/Region)
21.3.7.4. Sales Footprint
21.3.7.5. Strategy Overview
21.3.8. Cooperatie Koninklijke Avebe U.A.
21.3.8.1. Overview
21.3.8.2. Product Portfolio
21.3.8.3. Profitability by Market Segments (Product/Channel/Region)
21.3.8.4. Sales Footprint
21.3.8.5. Strategy Overview
21.3.9. MGP Ingredients, Inc.
21.3.9.1. Overview
21.3.9.2. Product Portfolio
21.3.9.3. Profitability by Market Segments (Product/Channel/Region)
21.3.9.4. Sales Footprint
21.3.9.5. Strategy Overview
21.3.10. Lyckeby Starch AB
21.3.10.1. Overview
21.3.10.2. Product Portfolio
21.3.10.3. Profitability by Market Segments (Product/Channel/Region)
21.3.10.4. Sales Footprint
21.3.10.5. Strategy Overview
21.3.11. KMC Kartoffelmelcentralen A.M.B.A
21.3.11.1. Overview
21.3.11.2. Product Portfolio
21.3.11.3. Profitability by Market Segments (Product/Channel/Region)
21.3.11.4. Sales Footprint
21.3.11.5. Strategy Overview
21.3.12. Banpong Tapioca Flour Industrial Co., Ltd.
21.3.12.1. Overview
21.3.12.2. Product Portfolio
21.3.12.3. Profitability by Market Segments (Product/Channel/Region)
21.3.12.4. Sales Footprint
21.3.12.5. Strategy Overview
21.3.13. Blattmann Schweiz AG
21.3.13.1. Overview
21.3.13.2. Product Portfolio
21.3.13.3. Profitability by Market Segments (Product/Channel/Region)
21.3.13.4. Sales Footprint
21.3.13.5. Strategy Overview
21.3.14. Axereal
21.3.14.1. Overview
21.3.14.2. Product Portfolio
21.3.14.3. Profitability by Market Segments (Product/Channel/Region)
21.3.14.4. Sales Footprint
21.3.14.5. Strategy Overview
21.3.15. Ingredion Incorporated
21.3.15.1. Overview
21.3.15.2. Product Portfolio
21.3.15.3. Profitability by Market Segments (Product/Channel/Region)
21.3.15.4. Sales Footprint
21.3.15.5. Strategy Overview
21.3.16. AGRANA Beteiligungs-AG
21.3.16.1. Overview
21.3.16.2. Product Portfolio
21.3.16.3. Profitability by Market Segments (Product/Channel/Region)
21.3.16.4. Sales Footprint
21.3.16.5. Strategy Overview
Note: The list of companies above is tentative and it is subjected to change based on research process and/or customization requirements.
22. Assumptions and Acronyms Used
23. Research Methodology