Global Water Cooled Capacitors Market Overview (2025–2032)
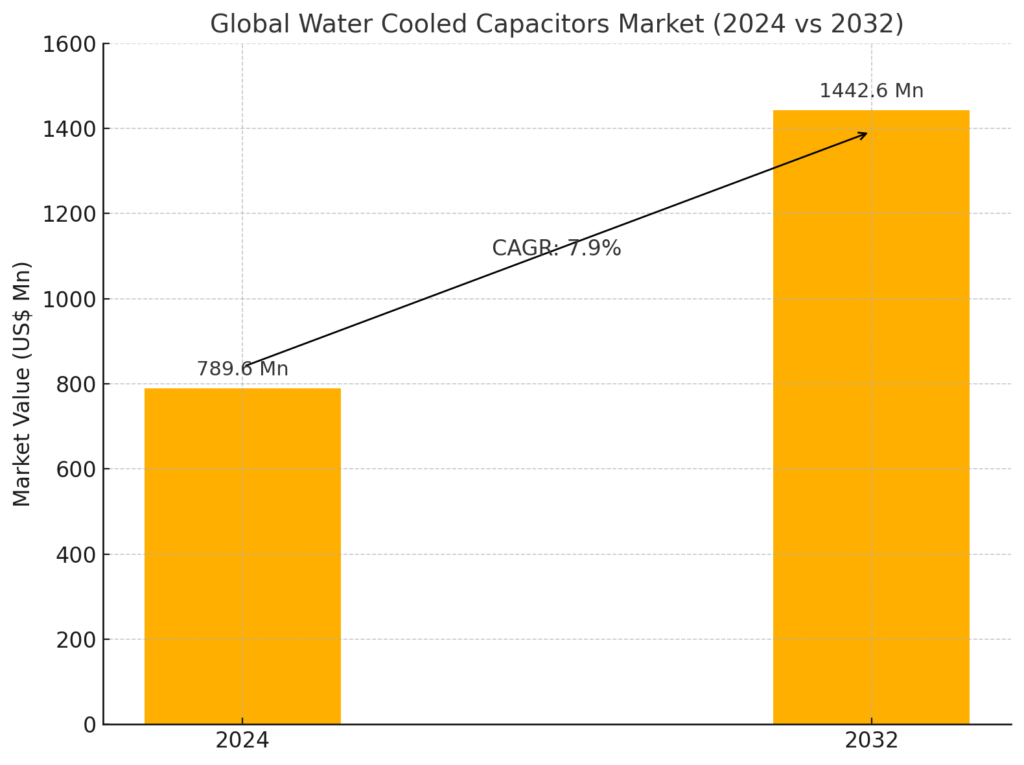
The global water cooled capacitors market is experiencing robust growth, driven by the increasing demand for high-performance capacitors in temperature-sensitive and high-power industrial applications. In 2024, the market was valued at US$ 789.6 million, and it is projected to grow at a CAGR of 7.9%, reaching US$ 1,442.6 million by 2032.
Water cooled capacitors, which are electronic components capable of storing and discharging electrical energy efficiently, are designed with integrated water-cooling systems. These systems are critical in ensuring thermal stability and reliability, especially in high-frequency or high-voltage environments. Applications include induction heating, dielectric heating, industrial welding, and more recently, aerospace and automotive sectors, where temperature and insulation stability are essential.
Key Growth Drivers
-
High-Temperature Stability & Insulating Performance
Water cooled capacitors are gaining prominence due to their ability to maintain consistent performance in harsh environments, withstanding temperatures between 55°C and 200°C. This makes them ideal for aerospace avionics, automotive electronics, and electric braking systems, where high durability and thermal resilience are required. -
Technological Advancements in Power Electronics
As the electronics industry shifts toward higher power densities and greater energy efficiency, water cooled capacitors are increasingly being adopted in industrial lasers, charging stations, and microgrids. Their superior cooling capability ensures reliable operation and longer lifespan of components, thus reducing maintenance costs. -
Transition to Electrification in Transportation
Both the aerospace and automotive sectors are rapidly transitioning from hydraulic and mechanical systems to electric systems, increasing demand for compact, high-efficiency capacitors. The aerospace industry, in particular, accounted for 24.6% of market share in 2024, and is forecasted to grow at 6.5% CAGR over the forecast period.
Regional Insights
-
Europe led the global market with a 29.2% share in 2024, driven by the strong presence of industrial equipment manufacturers and a growing shift toward sustainable technologies. Within Europe, Germany stands out with a 20.9% market share due to its extensive use of water cooled capacitors in induction heating and power factor correction systems.
-
The South Asia & Pacific region is expected to register the fastest growth at a CAGR of 10.2%, with India emerging as a key growth engine. The Indian market is projected to grow at 11.6% CAGR, backed by expanding infrastructure, electrification projects, and government support for renewable energy.
-
In North America, particularly the United States, innovation in water cooling technologies for medium- to high-power applications is propelling market expansion. The U.S. accounted for 15.9% of global market share in 2024.
Application Insights
-
Heating & Melting applications represent the dominant segment, where water cooled capacitors are integral to induction heating, forging, welding, and annealing operations. The widespread use of electrically conductive heating methods has solidified the position of these capacitors in industrial processes.
-
Other emerging applications include medical imaging, resonant circuits, plasma applications, wireless power transfer, and EV charging infrastructure, highlighting the increasing versatility of water cooled capacitors across new-age sectors.
Material & Segment Insights
-
In terms of capacitor materials, polypropylene-based capacitors held the largest market share of 35% in 2024, due to their high voltage resistance, thermal stability, and relatively low cost.
-
By voltage rating, the market is segmented into:
-
Low (up to 1 KV)
-
Medium (1–3.5 KV)
-
High (above 3.5 KV)
-
-
End-use industries span:
-
Automotive
-
Aerospace
-
Steel
-
Oil & Gas
-
Railways
-
Renewables
-
The OEM market remains the primary channel, but the replacement market is also witnessing steady growth as industries prioritize system upgrades and energy efficiency improvements.
Competitive Landscape
Leading players in the global water cooled capacitors market are focusing on innovation and product enhancement. Companies such as Clariant Power System, CORNELL DUBILIER, TDK Corporation, and VISHAY INTERTECHNOLOGY are launching advanced capacitor lines with higher capacitance, fail-safe mechanisms, and improved performance for specialized applications.
Notable developments include:
-
TDK Corporation’s expansion of its CN series MLCCs in 2021, offering greater capacitance and equipment efficiency.
-
Cornell Dubilier’s patented PCD series with built-in fail-safe protection for AC harmonic filtering.
These innovations are enabling capacitors to be more compact, efficient, and durable — opening up new use cases in high-growth industries.
The global water cooled capacitors market is poised for sustained expansion, driven by the need for efficient energy storage solutions in high-power, high-temperature applications. With advancements in electrification, industrial automation, and aerospace systems, demand is expected to remain strong. Regional growth in emerging economies, technological disruption, and product innovation will define the competitive dynamics of this market through 2032.
Table of Content
1. Executive Summary
1.1. Global Market Outlook
1.2. Demand Side Trends
1.3. Supply Side Trends
1.4. Analysis and Recommendations
2. Market Overview
2.1. Market Coverage / Taxonomy
2.2. Market Definition / Scope / Limitations
2.3. Role of Consultants & Contractors
3. Key Market Trends
3.1. Key Trends Impacting the Market
3.2. Product Innovation / Development Trends
4. Pricing Analysis
4.1. Pricing Analysis, By Water Cooled Capacitor
4.2. Average Pricing Analysis Benchmark
5. Global Water Cooled Capacitors Market Demand (Value in US$ Mn) Analysis 2019-2032
5.1. Historical Market Value (US$ Mn) Analysis, 2019-2023
5.2. Current and Future Market Value (US$ Mn) Projections, 2024-2032
5.2.1. Y-o-Y Growth Trend Analysis
5.2.2. Absolute $ Opportunity Analysis
6. Market Background
6.1. Macro-Economic Factors
6.2. Forecast Factors – Relevance & Impact
6.3. Value Chain Analysis
6.4. Market Dynamics
6.4.1. Drivers
6.4.2. Restraints
6.4.3. Opportunities
7. Global Water Cooled Capacitors Market Analysis 2019-2032, by Capacitor Type
7.1. Introduction / Key Findings
7.2. Historical Market Size (US$ Mn) Analysis By Capacitor Type, 2019-2023
7.3. Current and Future Market Size (US$ Mn) Analysis and Forecast By Capacitor Type, 2024-2032
7.3.1. Polypropylene
7.3.2. Ceramic
7.3.3. Aluminum
7.3.4. Others
7.4. Market Attractiveness Analysis By Capacitor Type
7.5. Penetration and Growth Opportunities
8. Global Water Cooled Capacitors Market Analysis 2019-2032, by Voltage Rating
8.1. Introduction / Key Findings
8.2. Historical Market Size (US$ Mn) Analysis By Voltage Rating, 2019-2023
8.3. Current and Future Market Size (US$ Mn) Analysis and Forecast By Voltage Rating, 2024-2032
8.3.1. Low (up to 1 KV)
8.3.2. Medium (more than 1 KV and up to 3.5 KV)
8.3.3. High (more than 3.5 KV)
8.4. Market Attractiveness Analysis By Voltage Rating
8.5. Penetration and Growth Opportunities
9. Global Water Cooled Capacitors Market Analysis 2019-2032, by Frequency Rating
9.1. Introduction / Key Findings
9.2. Historical Market Size (US$ Mn) Analysis By Frequency Rating, 2019-2023
9.3. Current and Future Market Size (US$ Mn) Analysis and Forecast By Frequency Rating, 2024-2032
9.3.1. Medium
9.3.2. High
9.4. Market Attractiveness Analysis By Frequency Rating
9.5. Penetration and Growth Opportunities
10. Global Water Cooled Capacitors Market Analysis 2019-2032, by End Use Industry
10.1. Introduction / Key Findings
10.2. Historical Market Size (US$ Mn) Analysis By End Use Industry, 2019-2023
10.3. Current and Future Market Size (US$ Mn) Analysis and Forecast By End Use Industry, 2024-2032
10.3.1. Automotive
10.3.2. Aerospace
10.3.3. Steel
10.3.4. Railways
10.3.5. Oil & Gas
10.3.6. Renewables
10.3.7. Others
10.4. Market Attractiveness Analysis By End Use Industry
10.5. Penetration and Growth Opportunities
11. Global Water Cooled Capacitors Market Analysis 2019-2032, by Application
11.1. Introduction / Key Findings
11.2. Historical Market Size (US$ Mn) Analysis By Application, 2019-2023
11.3. Current and Future Market Size (US$ Mn) Analysis and Forecast By Application, 2024-2032
11.3.1. Heating & Melting
11.3.2. Resonant Circuits/RF
11.3.3. Medical Imaging
11.3.4. Plasma Applications
11.3.5. Wireless Power Transfer
11.3.6. EV Charging
11.3.7. Others
11.4. Market Attractiveness Analysis By Application
11.5. Penetration and Growth Opportunities
12. Global Water Cooled Capacitors Market Analysis 2019-2032, by Provider Type
12.1. Introduction / Key Findings
12.2. Historical Market Size (US$ Mn) Analysis By Provider Type, 2019-2023
12.3. Current and Future Market Size (US$ Mn) Analysis and Forecast By Provider Type, 2024-2032
12.3.1. OEM Market
12.3.2. Replacement Market
12.4. Market Attractiveness Analysis By Provider Type
12.5. Penetration and Growth Opportunities
13. Global Water Cooled Capacitors Market Analysis 2019-2032, by Region
13.1. Introduction / Key Findings
13.2. Historical Market Size (US$ Mn) Analysis By Region, 2019-2023
13.3. Current and Future Market Size (US$ Mn) Analysis and Forecast By Region, 2024-2032
13.3.1. North America
13.3.2. Latin America
13.3.3. Europe
13.3.4. East Asia
13.3.5. South Asia and Pacific
13.3.6. Middle East & Africa
13.4. Market Attractiveness Analysis By Region
13.5. Penetration and Growth Opportunities
14. North America Water Cooled Capacitors Market Analysis 2019-2032
14.1. Introduction
14.2. Historical Market Size (US$ Mn) Trend Analysis By Market Taxonomy, 2019-2023
14.3. Current and Future Market Size (US$ Mn) Forecast By Market Taxonomy, 2024-2032
14.3.1. By Capacitor Type
14.3.2. By Voltage Rating
14.3.3. By Frequency Rating
14.3.4. By End Use Industry
14.3.5. By Application
14.3.6. By Provider Type
14.3.7. By Country
14.3.7.1. U.S.
14.3.7.2. Canada
14.4. Market Attractiveness Analysis
14.4.1. By Capacitor Type
14.4.2. By Voltage Rating
14.4.3. By Frequency Rating
14.4.4. By End Use Industry
14.4.5. By Application
14.4.6. By Provider Type
14.4.7. By Country
14.5. Market Trends
15. Latin America Water Cooled Capacitors Market Analysis 2019-2032
15.1. Introduction
15.2. Historical Market Size (US$ Mn) Trend Analysis By Market Taxonomy, 2019-2023
15.3. Current and Future Market Size (US$ Mn) Forecast By Market Taxonomy, 2024-2032
15.3.1. By Capacitor Type
15.3.2. By Voltage Rating
15.3.3. By Frequency Rating
15.3.4. By End Use Industry
15.3.5. By Application
15.3.6. By Provider Type
15.3.7. By Country
15.3.7.1. Brazil
15.3.7.2. Mexico
15.3.7.3. Rest of Latin America
15.4. Market Attractiveness Analysis
15.4.1. By Capacitor Type
15.4.2. By Voltage Rating
15.4.3. By Frequency Rating
15.4.4. By End Use Industry
15.4.5. By Application
15.4.6. By Provider Type
15.4.7. By Country
15.5. Market Trends
16. Europe Water Cooled Capacitors Market Analysis 2019-2032
16.1. Introduction
16.2. Historical Market Size (US$ Mn) Trend Analysis By Market Taxonomy, 2019-2023
16.3. Current and Future Market Size (US$ Mn) Forecast By Market Taxonomy, 2024-2032
16.3.1. By Capacitor Type
16.3.2. By Voltage Rating
16.3.3. By Frequency Rating
16.3.4. By End Use Industry
16.3.5. By Application
16.3.6. By Provider Type
16.3.7. By Country
16.3.7.1. Germany
16.3.7.2. Italy
16.3.7.3. France
16.3.7.4. U.K.
16.3.7.5. Spain
16.3.7.6. BENELUX
16.3.7.7. Russia
16.3.7.8. Rest of Europe
16.4. Market Attractiveness Analysis
16.4.1. By Capacitor Type
16.4.2. By Voltage Rating
16.4.3. By Frequency Rating
16.4.4. By End Use Industry
16.4.5. By Application
16.4.6. By Provider Type
16.4.7. By Country
16.5. Market Trends
17. South Asia and Pacific Water Cooled Capacitors Market Analysis 2019-2032
17.1. Introduction
17.2. Historical Market Size (US$ Mn) Trend Analysis By Market Taxonomy, 2019-2023
17.3. Current and Future Market Size (US$ Mn) Forecast By Market Taxonomy, 2024-2032
17.3.1. By Capacitor Type
17.3.2. By Voltage Rating
17.3.3. By Frequency Rating
17.3.4. By End Use Industry
17.3.5. By Application
17.3.6. By Provider Type
17.3.7. By Country
17.3.7.1. India
17.3.7.2. Thailand
17.3.7.3. Indonesia
17.3.7.4. Malaysia
17.3.7.5. Australia & New Zealand
17.3.7.6. Rest of South Asia and Pacific
17.4. Market Attractiveness Analysis
17.4.1. By Capacitor Type
17.4.2. By Voltage Rating
17.4.3. By Frequency Rating
17.4.4. By End Use Industry
17.4.5. By Application
17.4.6. By Provider Type
17.4.7. By Country
17.5. Market Trends
18. East Asia Water Cooled Capacitors Market Analysis 2019-2032
18.1. Introduction
18.2. Historical Market Size (US$ Mn) Trend Analysis By Market Taxonomy, 2019-2023
18.3. Current and Future Market Size (US$ Mn) Forecast By Market Taxonomy, 2024-2032
18.3.1. By Capacitor Type
18.3.2. By Voltage Rating
18.3.3. By Frequency Rating
18.3.4. By End Use Industry
18.3.5. By Application
18.3.6. By Provider Type
18.3.7. By Country
18.3.7.1. China
18.3.7.2. Japan
18.3.7.3. South Korea
18.4. Market Attractiveness Analysis
18.4.1. By Capacitor Type
18.4.2. By Voltage Rating
18.4.3. By Frequency Rating
18.4.4. By End Use Industry
18.4.5. By Application
18.4.6. By Provider Type
18.4.7. By Country
18.5. Market Trends
19. Middle East and Africa Water Cooled Capacitors Market Analysis 2019-2032
19.1. Introduction
19.2. Historical Market Size (US$ Mn) Trend Analysis By Market Taxonomy, 2019-2023
19.3. Current and Future Market Size (US$ Mn) Forecast By Market Taxonomy, 2024-2032
19.3.1. By Capacitor Type
19.3.2. By Voltage Rating
19.3.3. By Frequency Rating
19.3.4. By End Use Industry
19.3.5. By Application
19.3.6. By Provider Type
19.3.7. By Country
19.3.7.1. GCC Countries
19.3.7.2. Turkey
19.3.7.3. South Africa
19.3.7.4. Rest of Middle East and Africa
19.4. Market Attractiveness Analysis
19.4.1. By Capacitor Type
19.4.2. By Voltage Rating
19.4.3. By Frequency Rating
19.4.4. By End Use Industry
19.4.5. By Application
19.4.6. By Provider Type
19.4.7. By Country
19.5. Market Trends
20. Key Countries Analysis- Water Cooled Capacitors Market
20.1. U.S. Water Cooled Capacitors Market Analysis
20.1.1. By Capacitor Type
20.1.2. By Voltage Rating
20.1.3. By Frequency Rating
20.1.4. By End Use Industry
20.1.5. By Application
20.1.6. By Provider Type
20.2. Canada Water Cooled Capacitors Market Analysis
20.2.1. By Capacitor Type
20.2.2. By Voltage Rating
20.2.3. By Frequency Rating
20.2.4. By End Use Industry
20.2.5. By Application
20.2.6. By Provider Type
20.3. Mexico Water Cooled Capacitors Market Analysis
20.3.1. By Capacitor Type
20.3.2. By Voltage Rating
20.3.3. By Frequency Rating
20.3.4. By End Use Industry
20.3.5. By Application
20.3.6. By Provider Type
20.4. Brazil Water Cooled Capacitors Market Analysis
20.4.1. By Capacitor Type
20.4.2. By Voltage Rating
20.4.3. By Frequency Rating
20.4.4. By End Use Industry
20.4.5. By Application
20.4.6. By Provider Type
20.5. Rest of Latin America Water Cooled Capacitors Market Analysis
20.5.1. By Capacitor Type
20.5.2. By Voltage Rating
20.5.3. By Frequency Rating
20.5.4. By End Use Industry
20.5.5. By Application
20.5.6. By Provider Type
20.6. Germany Water Cooled Capacitors Market Analysis
20.6.1. By Capacitor Type
20.6.2. By Voltage Rating
20.6.3. By Frequency Rating
20.6.4. By End Use Industry
20.6.5. By Application
20.6.6. By Provider Type
20.7. Italy Water Cooled Capacitors Market Analysis
20.7.1. By Capacitor Type
20.7.2. By Voltage Rating
20.7.3. By Frequency Rating
20.7.4. By End Use Industry
20.7.5. By Application
20.7.6. By Provider Type
20.8. France Water Cooled Capacitors Market Analysis
20.8.1. By Capacitor Type
20.8.2. By Voltage Rating
20.8.3. By Frequency Rating
20.8.4. By End Use Industry
20.8.5. By Application
20.8.6. By Provider Type
20.9. U.K. Water Cooled Capacitors Market Analysis
20.9.1. By Capacitor Type
20.9.2. By Voltage Rating
20.9.3. By Frequency Rating
20.9.4. By End Use Industry
20.9.5. By Application
20.9.6. By Provider Type
20.10. Spain Water Cooled Capacitors Market Analysis
20.10.1. By Capacitor Type
20.10.2. By Voltage Rating
20.10.3. By Frequency Rating
20.10.4. By End Use Industry
20.10.5. By Application
20.10.6. By Provider Type
20.11. BENELUX Water Cooled Capacitors Market Analysis
20.11.1. By Capacitor Type
20.11.2. By Voltage Rating
20.11.3. By Frequency Rating
20.11.4. By End Use Industry
20.11.5. By Application
20.11.6. By Provider Type
20.12. Russia Water Cooled Capacitors Market Analysis
20.12.1. By Capacitor Type
20.12.2. By Voltage Rating
20.12.3. By Frequency Rating
20.12.4. By End Use Industry
20.12.5. By Application
20.12.6. By Provider Type
20.13. Rest of Europe Water Cooled Capacitors Market Analysis
20.13.1. By Capacitor Type
20.13.2. By Voltage Rating
20.13.3. By Frequency Rating
20.13.4. By End Use Industry
20.13.5. By Application
20.13.6. By Provider Type
20.14. China Water Cooled Capacitors Market Analysis
20.14.1. By Capacitor Type
20.14.2. By Voltage Rating
20.14.3. By Frequency Rating
20.14.4. By End Use Industry
20.14.5. By Application
20.14.6. By Provider Type
20.15. Japan Water Cooled Capacitors Market Analysis
20.15.1. By Capacitor Type
20.15.2. By Voltage Rating
20.15.3. By Frequency Rating
20.15.4. By End Use Industry
20.15.5. By Application
20.15.6. By Provider Type
20.16. South Korea Water Cooled Capacitors Market Analysis
20.16.1. By Capacitor Type
20.16.2. By Voltage Rating
20.16.3. By Frequency Rating
20.16.4. By End Use Industry
20.16.5. By Application
20.16.6. By Provider Type
20.17. India Water Cooled Capacitors Market Analysis
20.17.1. By Capacitor Type
20.17.2. By Voltage Rating
20.17.3. By Frequency Rating
20.17.4. By End Use Industry
20.17.5. By Application
20.17.6. By Provider Type
20.18. Thailand Water Cooled Capacitors Market Analysis
20.18.1. By Capacitor Type
20.18.2. By Voltage Rating
20.18.3. By Frequency Rating
20.18.4. By End Use Industry
20.18.5. By Application
20.18.6. By Provider Type
20.19. Indonesia Water Cooled Capacitors Market Analysis
20.19.1. By Capacitor Type
20.19.2. By Voltage Rating
20.19.3. By Frequency Rating
20.19.4. By End Use Industry
20.19.5. By Application
20.19.6. By Provider Type
20.20. Malaysia Water Cooled Capacitors Market Analysis
20.20.1. By Capacitor Type
20.20.2. By Voltage Rating
20.20.3. By Frequency Rating
20.20.4. By End Use Industry
20.20.5. By Application
20.20.6. By Provider Type
20.21. Australia and New Zealand Water Cooled Capacitors Market Analysis
20.21.1. By Capacitor Type
20.21.2. By Voltage Rating
20.21.3. By Frequency Rating
20.21.4. By End Use Industry
20.21.5. By Application
20.21.6. By Provider Type
20.22. Rest of South Asia and Pacific Water Cooled Capacitors Market Analysis
20.22.1. By Capacitor Type
20.22.2. By Voltage Rating
20.22.3. By Frequency Rating
20.22.4. By End Use Industry
20.22.5. By Application
20.22.6. By Provider Type
20.23. GCC Countries Water Cooled Capacitors Market Analysis
20.23.1. By Capacitor Type
20.23.2. By Voltage Rating
20.23.3. By Frequency Rating
20.23.4. By End Use Industry
20.23.5. By Application
20.23.6. By Provider Type
20.24. Turkey Water Cooled Capacitors Market Analysis
20.24.1. By Capacitor Type
20.24.2. By Voltage Rating
20.24.3. By Frequency Rating
20.24.4. By End Use Industry
20.24.5. By Application
20.24.6. By Provider Type
20.25. South Africa Water Cooled Capacitors Market Analysis
20.25.1. By Capacitor Type
20.25.2. By Voltage Rating
20.25.3. By Frequency Rating
20.25.4. By End Use Industry
20.25.5. By Application
20.25.6. By Provider Type
20.26. Rest of Middle East and Africa Water Cooled Capacitors Market Analysis
20.26.1. By Capacitor Type
20.26.2. By Voltage Rating
20.26.3. By Frequency Rating
20.26.4. By End Use Industry
20.26.5. By Application
20.26.6. By Provider Type
21. Market Structure Analysis
21.1. Market Analysis by Tier of Companies
21.2. Market Share Analysis of Top Players
21.3. Market Presence Analysis, Regional footprint by Players
22. Competition Analysis
22.1. Competition Dashboard
22.2. Competition Deep Dive
22.2.1. Clariant Power System Ltd.
22.2.1.1. Business Overview
22.2.1.2. Product Portfolio
22.2.1.3. Profitability by Market Segments (Business Segment/Region)
22.2.1.4. Recent Market Development
22.2.1.5. SWOT Analysis (Includes Industry SWOT Analysis)
22.2.1.6. Partner Eco-System (Distributors, Resellers, VARs)
22.2.1.7. Strategy Overview
22.2.2. Marxelec
22.2.2.1. Business Overview
22.2.2.2. Product Portfolio
22.2.2.3. Profitability by Market Segments (Business Segment/Region)
22.2.2.4. Recent Market Development
22.2.2.5. SWOT Analysis (Includes Industry SWOT Analysis)
22.2.2.6. Partner Eco-System (Distributors, Resellers, VARs)
22.2.2.7. Strategy Overview
22.2.3. Magnewin Energy Private Limited
22.2.3.1. Business Overview
22.2.3.2. Product Portfolio
22.2.3.3. Profitability by Market Segments (Business Segment/Region)
22.2.3.4. Recent Market Development
22.2.3.5. SWOT Analysis (Includes Industry SWOT Analysis)
22.2.3.6. Partner Eco-System (Distributors, Resellers, VARs)
22.2.3.7. Strategy Overview
22.2.4. CORNELL DUBILIER MARKETING, INC.
22.2.4.1. Business Overview
22.2.4.2. Product Portfolio
22.2.4.3. Profitability by Market Segments (Business Segment/Region)
22.2.4.4. Recent Market Development
22.2.4.5. SWOT Analysis (Includes Industry SWOT Analysis)
22.2.4.6. Partner Eco-System (Distributors, Resellers, VARs)
22.2.4.7. Strategy Overview
22.2.5. GE Grid Solutions
22.2.5.1. Business Overview
22.2.5.2. Product Portfolio
22.2.5.3. Profitability by Market Segments (Business Segment/Region)
22.2.5.4. Recent Market Development
22.2.5.5. SWOT Analysis (Includes Industry SWOT Analysis)
22.2.5.6. Partner Eco-System (Distributors, Resellers, VARs)
22.2.5.7. Strategy Overview
22.2.6. ZEZ SILKO
22.2.6.1. Business Overview
22.2.6.2. Product Portfolio
22.2.6.3. Profitability by Market Segments (Business Segment/Region)
22.2.6.4. Recent Market Development
22.2.6.5. SWOT Analysis (Includes Industry SWOT Analysis)
22.2.6.6. Partner Eco-System (Distributors, Resellers, VARs)
22.2.6.7. Strategy Overview
22.2.7. High Energy Corp
22.2.7.1. Business Overview
22.2.7.2. Product Portfolio
22.2.7.3. Profitability by Market Segments (Business Segment/Region)
22.2.7.4. Recent Market Development
22.2.7.5. SWOT Analysis (Includes Industry SWOT Analysis)
22.2.7.6. Partner Eco-System (Distributors, Resellers, VARs)
22.2.7.7. Strategy Overview
22.2.8. Celem
22.2.8.1. Business Overview
22.2.8.2. Product Portfolio
22.2.8.3. Profitability by Market Segments (Business Segment/Region)
22.2.8.4. Recent Market Development
22.2.8.5. SWOT Analysis (Includes Industry SWOT Analysis)
22.2.8.6. Partner Eco-System (Distributors, Resellers, VARs)
22.2.8.7. Strategy Overview
22.2.9. Jiande Haihua Electric Co.,Ltd
22.2.9.1. Business Overview
22.2.9.2. Product Portfolio
22.2.9.3. Profitability by Market Segments (Business Segment/Region)
22.2.9.4. Recent Market Development
22.2.9.5. SWOT Analysis (Includes Industry SWOT Analysis)
22.2.9.6. Partner Eco-System (Distributors, Resellers, VARs)
22.2.9.7. Strategy Overview
22.2.10. VISHAY INTERTECHNOLOGY, INC.
22.2.10.1. Business Overview
22.2.10.2. Product Portfolio
22.2.10.3. Profitability by Market Segments (Business Segment/Region)
22.2.10.4. Recent Market Development
22.2.10.5. SWOT Analysis (Includes Industry SWOT Analysis)
22.2.10.6. Partner Eco-System (Distributors, Resellers, VARs)
22.2.10.7. Strategy Overview
22.2.11. YANGZHOU POSITIONING TECH CO., LTD.
22.2.11.1. Business Overview
22.2.11.2. Product Portfolio
22.2.11.3. Profitability by Market Segments (Business Segment/Region)
22.2.11.4. Recent Market Development
22.2.11.5. SWOT Analysis (Includes Industry SWOT Analysis)
22.2.11.6. Partner Eco-System (Distributors, Resellers, VARs)
22.2.11.7. Strategy Overview
22.2.12. Sailing Tech
22.2.12.1. Business Overview
22.2.12.2. Product Portfolio
22.2.12.3. Profitability by Market Segments (Business Segment/Region)
22.2.12.4. Recent Market Development
22.2.12.5. SWOT Analysis (Includes Industry SWOT Analysis)
22.2.12.6. Partner Eco-System (Distributors, Resellers, VARs)
22.2.12.7. Strategy Overview
23. Assumptions and Acronyms Used
24. Research Methodology
Report Purchase Information
| Attribute | Details |
|---|---|
| Report Price | USD 4,995 |
| Published Date | 9 May 2025 |
| Delivery Format | PDF & Excel |
| Number of Pages | 200 pages |
| Delivery Lead Time | Within 3 working days |
For direct email inquiries, please contact us at:
📩 mr@marketresearch.co.jp