 | • レポートコード:IMA63994NG8021 • 出版社/出版日:IMARC / 2026年3月 • レポート形態:英語、PDF+Excel、約120ページ • 納品方法:Eメール(納期:3日) • 産業分類:電気 |
| Single User(1名様閲覧用、印刷不可) | ¥623,844 (USD3,999) | ▷ お問い合わせ |
| Five User(5名様閲覧用、印刷不可) | ¥779,844 (USD4,999) | ▷ お問い合わせ |
| Corporate User(閲覧人数無制限、印刷可) | ¥935,844 (USD5,999) | ▷ お問い合わせ |
• お支払方法:銀行振込(納品後、ご請求書送付)
レポート概要
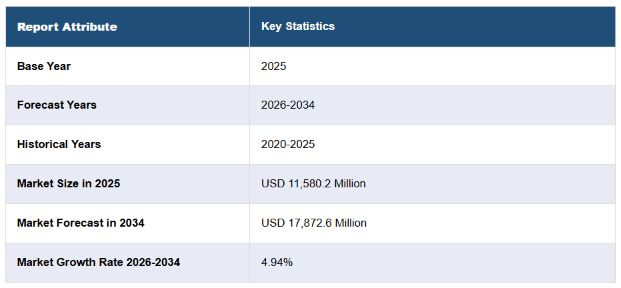
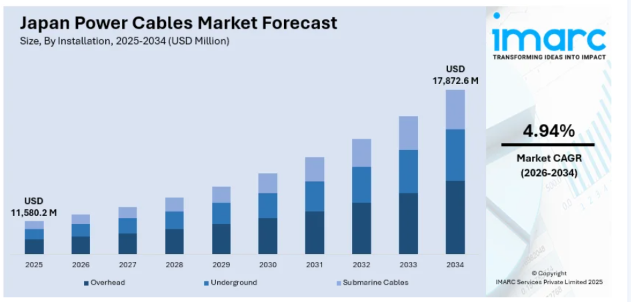
| 日本の電力ケーブル市場規模は、11,580.2百万米ドルに達しました。今後、IMARC Groupは、同市場が17,872.6百万米ドルに達すると予測しており、2026年から2034年にかけて年平均成長率(CAGR)4.94%を記録すると見込まれています。この市場の成長を牽引しているのは、再生可能エネルギーインフラへの需要の高まり、都市化、スマートグリッド技術の進歩、炭素排出量削減を目的とした政府の支援政策、電気自動車(EV)の販売台数の増加、そして信頼性が高く効率的な配電ネットワークへのニーズの高まりである。 日本の電力ケーブル市場の動向: 再生可能エネルギーの台頭と高電圧電力ケーブルへの需要の高まり 2050年までにネットゼロ排出を達成するという日本の目標が、電力ケーブル業界の力強い成長を後押ししている。特に、風力、太陽光、水力などの再生可能エネルギー源への依存度が高まっていることがその要因である。日本が再生可能エネルギーへの移行を加速させるにつれ、再生可能エネルギー発電所から都市部や工業地帯へエネルギーを伝送するために不可欠な、高電圧および特殊な電力ケーブルへの需要が高まっている。この移行の中心となるのが、政府が掲げる野心的な再生可能エネルギー目標であり、日本は2030年までに発電構成における再生可能エネルギーの割合を36~38%に引き上げることを目指している。この転換には送電インフラへの多額の投資が必要であり、それが先進的な電力ケーブルの需要を直接的に後押ししている。さらに、洋上風力発電の利用拡大に伴い、より高い電圧に対応し、長距離にわたる効率的な送電を保証できる海底ケーブルの需要が高まっている。また、日本は2030年までに洋上風力発電の設備容量を10GWとする目標を掲げており、これが高電圧ケーブルへの需要をさらに刺激し、電力ケーブル市場の成長を牽引している。 EVインフラの拡大と充電ステーション用ケーブルの需要 日本におけるEVの急速な普及は、電力ケーブル、特にEV充電ステーション向けの需要を大幅に押し上げている。日本は2035年までに販売されるすべての新車を電気自動車またはハイブリッド車にすることを目指しており、EVを支えるインフラが急速に拡大している。これには、広範なEV充電ステーションネットワークの整備が含まれており、電力を効率的に供給できる高品質な電力ケーブルが必要となる。日本自動車工業会(JAMA)によると、2035年までに日本のEV台数は1,000万台を超えると予想されており、充電インフラに対する大きな需要が生まれる見込みである。2024年時点で、日本には約54,000か所のEV充電ステーションがあり、近い将来にこの数を大幅に増やす計画がある。この拡大に伴い、急速充電ステーションに必要な高電力負荷に対応しつつ、安全性と耐久性を確保できる高性能ケーブルの使用が不可欠となっている。EVへの移行は、超急速充電用ケーブルの開発も促進しており、拡大を続ける日本のEVインフラにおいて、先進的な電力ケーブルへの需要をさらに押し上げている。 日本の電力ケーブル市場のセグメンテーション: IMARC Groupは、市場の各セグメントにおける主要なトレンドの分析に加え、2026年から2034年までの地域・国別の予測を提供している。本レポートでは、設置形態、電圧、材質、および最終用途セクターに基づいて市場を分類しています。 設置形態に関する分析: 架空 地下 海底ケーブル 本レポートでは、設置形態に基づく市場の詳細な分類と分析を提供しています。これには、架空ケーブル、地下ケーブル、および海底ケーブルが含まれます。 電圧に関する分析: 高 中 低 本レポートでは、電圧に基づく市場の詳細な分類と分析も提供されています。これには、高電圧、中電圧、低電圧が含まれます。 材質に関する分析: 銅 アルミニウム 本レポートでは、材質に基づく市場の詳細な分類と分析を提供しています。これには、銅とアルミニウムが含まれます。 最終用途セクターに関する分析: 電力 石油・ガス 化学 製造 金属・鉱業 インフラ 運輸 その他 本レポートでは、最終用途セクターに基づく市場の詳細な分類と分析も提供されています。これには、電力、石油・ガス、化学、製造、金属・鉱業、インフラ、運輸、その他が含まれます。 地域別インサイト: 関東地方 関西・近畿地方 中部地方 九州・沖縄地域 東北地域 中国地域 北海道地域 四国地域 本レポートでは、関東地域、関西・近畿地域、中部地域、九州・沖縄地域、東北地域、中国地域、北海道地域、四国地域を含む、すべての主要地域市場に関する包括的な分析も提供されています。 競争環境: 本市場調査レポートでは、競争環境に関する包括的な分析も提供しています。市場構造、主要企業のポジショニング、成功している主要戦略、競争ダッシュボード、企業評価クアドラントなどの競争分析がレポートで取り上げられています。また、すべての主要企業の詳細なプロフィールも掲載されています。 |
The Japan power cables market size reached USD 11,580.2 Million in 2025. Looking forward, IMARC Group expects the market to reach USD 17,872.6 Million by 2034, exhibiting a growth rate (CAGR) of 4.94% during 2026-2034. The market is being driven by the increasing demand for renewable energy infrastructure, urbanization, advancements in smart grid technology, supportive government policies aimed at reducing carbon emissions, rising electric vehicle (EV) sales, and the escalating need for reliable and efficient power distribution networks.
Japan Power Cables Market Trends:
Rise in Renewable Energy and the Elevating Need for High-Voltage Power Cables
Japan’s goal of reaching net-zero emissions by 2050 is fueling strong growth in the power cable industry, especially as the country increasingly relies on renewable energy sources like wind, solar, and hydro power. As Japan accelerates its transition to renewables, the demand for high-voltage and specialized power cables, essential for transmitting energy from renewable generation sites to urban and industrial areas, is rising. The government’s ambitious renewable energy goals are central to this transition, with Japan aiming to achieve a 36-38% renewable share in its power generation mix by 2030. This shift requires substantial investments in power transmission infrastructure, which directly fuels the need for advanced power cables. Additionally, the growing use of offshore wind energy calls for subsea cables that can handle higher voltages and ensure efficient transmission over long distances. The country is also targeting 10 GW of installed offshore wind capacity by 2030, further stimulating demand for high-voltage cables and driving growth in the power cables market.
Expansion of EV Infrastructure and the Demand for Charging Station Cables
The rapid adoption of EVs in Japan is significantly driving the demand for power cables, especially for EV charging stations. With Japan aiming to make all new vehicles sold by 2035 electric or hybrid, the infrastructure supporting EVs is expanding rapidly. This includes the installation of a widespread network of EV charging stations, which requires high-quality power cables capable of efficiently delivering power. According to the Japan Automobile Manufacturers Association (JAMA), the number of EVs in Japan is expected to exceed 10 million by 2035, creating a substantial demand for charging infrastructure. As of 2024, Japan had around 54,000 EV charging stations, with plans to increase this number substantially over the near-term. This expansion necessitates the use of high-performance cables capable of handling the high power loads needed for fast-charging stations, while ensuring safety and durability. The shift to EVs is also driving the development of cables for ultra-fast charging, further boosting demand for advanced power cables in Japan’s growing EV infrastructure.
Japan Power Cables Market Segmentation:
IMARC Group provides an analysis of the key trends in each segment of the market, along with forecasts at the region/country level for 2026-2034. Our report has categorized the market based on installation, voltage, material, and end-use sector.
Installation Insights:
• Overhead
• Underground
• Submarine Cables
The report has provided a detailed breakup and analysis of the market based on the installation. This includes overhead, underground, and submarine cables.
Voltage Insights:
• High
• Medium
• Low
A detailed breakup and analysis of the market based on the voltage have also been provided in the report. This includes high, medium, and low.
Material Insights:
• Copper
• Aluminum
The report has provided a detailed breakup and analysis of the market based on the material. This includes copper and aluminum.
End-Use Sector Insights:
• Power
• Oil & Gas
• Chemical
• Manufacturing
• Metals & Mining
• Infrastructure
• Transportation
• Others
A detailed breakup and analysis of the market based on the end-use sector have also been provided in the report. This includes power, oil & gas, chemical, manufacturing, metals & mining, infrastructure, transportation, and others.
Regional Insights:
• Kanto Region
• Kansai/Kinki Region
• Central/Chubu Region
• Kyushu-Okinawa Region
• Tohoku Region
• Chugoku Region
• Hokkaido Region
• Shikoku Region
The report has also provided a comprehensive analysis of all the major regional markets, which include Kanto Region, Kansai/Kinki Region, Central/Chubu Region, Kyushu-Okinawa Region, Tohoku Region, Chugoku Region, Hokkaido Region, and Shikoku Region.
Competitive Landscape:
The market research report has also provided a comprehensive analysis of the competitive landscape. Competitive analysis such as market structure, key player positioning, top winning strategies, competitive dashboard, and company evaluation quadrant has been covered in the report. Also, detailed profiles of all major companies have been provided.
1 Preface
2 Scope and Methodology
2.1 Objectives of the Study
2.2 Stakeholders
2.3 Data Sources
2.3.1 Primary Sources
2.3.2 Secondary Sources
2.4 Market Estimation
2.4.1 Bottom-Up Approach
2.4.2 Top-Down Approach
2.5 Forecasting Methodology
3 Executive Summary
4 Japan Power Cables Market – Introduction
4.1 Overview
4.2 Market Dynamics
4.3 Industry Trends
4.4 Competitive Intelligence
5 Japan Power Cables Market Landscape
5.1 Historical and Current Market Trends (2020-2025)
5.2 Market Forecast (2026-2034)
6 Japan Power Cables Market – Breakup by Installation
6.1 Overhead
6.1.1 Overview
6.1.2 Historical and Current Market Trends (2020-2025)
6.1.3 Market Forecast (2026-2034)
6.2 Underground
6.2.1 Overview
6.2.2 Historical and Current Market Trends (2020-2025)
6.2.3 Market Forecast (2026-2034)
6.3 Submarine Cables
6.3.1 Overview
6.3.2 Historical and Current Market Trends (2020-2025)
6.3.3 Market Forecast (2026-2034)
7 Japan Power Cables Market – Breakup by Voltage
7.1 High
7.1.1 Overview
7.1.2 Historical and Current Market Trends (2020-2025)
7.1.3 Market Forecast (2026-2034)
7.2 Medium
7.2.1 Overview
7.2.2 Historical and Current Market Trends (2020-2025)
7.2.3 Market Forecast (2026-2034)
7.3 Low
7.3.1 Overview
7.3.2 Historical and Current Market Trends (2020-2025)
7.3.3 Market Forecast (2026-2034)
8 Japan Power Cables Market – Breakup by Material
8.1 Copper
8.1.1 Overview
8.1.2 Historical and Current Market Trends (2020-2025)
8.1.3 Market Forecast (2026-2034)
8.2 Aluminum
8.2.1 Overview
8.2.2 Historical and Current Market Trends (2020-2025)
8.2.3 Market Forecast (2026-2034)
9 Japan Power Cables Market – Breakup by End-Use Sector
9.1 Power
9.1.1 Overview
9.1.2 Historical and Current Market Trends (2020-2025)
9.1.3 Market Forecast (2026-2034)
9.2 Oil & Gas
9.2.1 Overview
9.2.2 Historical and Current Market Trends (2020-2025)
9.2.3 Market Forecast (2026-2034)
9.3 Chemical
9.3.1 Overview
9.3.2 Historical and Current Market Trends (2020-2025)
9.3.3 Market Forecast (2026-2034)
9.4 Manufacturing
9.4.1 Overview
9.4.2 Historical and Current Market Trends (2020-2025)
9.4.3 Market Forecast (2026-2034)
9.5 Metals & Mining
9.5.1 Overview
9.5.2 Historical and Current Market Trends (2020-2025)
9.5.3 Market Forecast (2026-2034)
9.6 Infrastructure
9.6.1 Overview
9.6.2 Historical and Current Market Trends (2020-2025)
9.6.3 Market Forecast (2026-2034)
9.7 Transportation
9.7.1 Overview
9.7.2 Historical and Current Market Trends (2020-2025)
9.7.3 Market Forecast (2026-2034)
9.8 Others
9.8.1 Historical and Current Market Trends (2020-2025)
9.8.2 Market Forecast (2026-2034)
10 Japan Power Cables Market – Breakup by Region
10.1 Kanto Region
10.1.1 Overview
10.1.2 Historical and Current Market Trends (2020-2025)
10.1.3 Market Breakup by Installation
10.1.4 Market Breakup by Voltage
10.1.5 Market Breakup by Material
10.1.6 Market Breakup by End-Use Sector
10.1.7 Key Players
10.1.8 Market Forecast (2026-2034)
10.2 Kansai/Kinki Region
10.2.1 Overview
10.2.2 Historical and Current Market Trends (2020-2025)
10.2.3 Market Breakup by Installation
10.2.4 Market Breakup by Voltage
10.2.5 Market Breakup by Material
10.2.6 Market Breakup by End-Use Sector
10.2.7 Key Players
10.2.8 Market Forecast (2026-2034)
10.3 Central/ Chubu Region
10.3.1 Overview
10.3.2 Historical and Current Market Trends (2020-2025)
10.3.3 Market Breakup by Installation
10.3.4 Market Breakup by Voltage
10.3.5 Market Breakup by Material
10.3.6 Market Breakup by End-Use Sector
10.3.7 Key Players
10.3.8 Market Forecast (2026-2034)
10.4 Kyushu-Okinawa Region
10.4.1 Overview
10.4.2 Historical and Current Market Trends (2020-2025)
10.4.3 Market Breakup by Installation
10.4.4 Market Breakup by Voltage
10.4.5 Market Breakup by Material
10.4.6 Market Breakup by End-Use Sector
10.4.7 Key Players
10.4.8 Market Forecast (2026-2034)
10.5 Tohoku Region
10.5.1 Overview
10.5.2 Historical and Current Market Trends (2020-2025)
10.5.3 Market Breakup by Installation
10.5.4 Market Breakup by Voltage
10.5.5 Market Breakup by Material
10.5.6 Market Breakup by End-Use Sector
10.5.7 Key Players
10.5.8 Market Forecast (2026-2034)
10.6 Chugoku Region
10.6.1 Overview
10.6.2 Historical and Current Market Trends (2020-2025)
10.6.3 Market Breakup by Installation
10.6.4 Market Breakup by Voltage
10.6.5 Market Breakup by Material
10.6.6 Market Breakup by End-Use Sector
10.6.7 Key Players
10.6.8 Market Forecast (2026-2034)
10.7 Hokkaido Region
10.7.1 Overview
10.7.2 Historical and Current Market Trends (2020-2025)
10.7.3 Market Breakup by Installation
10.7.4 Market Breakup by Voltage
10.7.5 Market Breakup by Material
10.7.6 Market Breakup by End-Use Sector
10.7.7 Key Players
10.7.8 Market Forecast (2026-2034)
10.8 Shikoku Region
10.8.1 Overview
10.8.2 Historical and Current Market Trends (2020-2025)
10.8.3 Market Breakup by Installation
10.8.4 Market Breakup by Voltage
10.8.5 Market Breakup by Material
10.8.6 Market Breakup by End-Use Sector
10.8.7 Key Players
10.8.8 Market Forecast (2026-2034)
11 Japan Power Cables Market – Competitive Landscape
11.1 Overview
11.2 Market Structure
11.3 Market Player Positioning
11.4 Top Winning Strategies
11.5 Competitive Dashboard
11.6 Company Evaluation Quadrant
12 Profiles of Key Players
12.1 Company A
12.1.1 Business Overview
12.1.2 Products Offered
12.1.3 Business Strategies
12.1.4 SWOT Analysis
12.1.5 Major News and Events
12.2 Company B
12.2.1 Business Overview
12.2.2 Products Offered
12.2.3 Business Strategies
12.2.4 SWOT Analysis
12.2.5 Major News and Events
12.3 Company C
12.3.1 Business Overview
12.3.2 Products Offered
12.3.3 Business Strategies
12.3.4 SWOT Analysis
12.3.5 Major News and Events
12.4 Company D
12.4.1 Business Overview
12.4.2 Products Offered
12.4.3 Business Strategies
12.4.4 SWOT Analysis
12.4.5 Major News and Events
12.5 Company E
12.5.1 Business Overview
12.5.2 Products Offered
12.5.3 Business Strategies
12.5.4 SWOT Analysis
12.5.5 Major News and Events
Company names have not been provided here as this is a sample TOC. Complete list to be provided in the final report.
13 Japan Power Cables Market – Industry Analysis
13.1 Drivers, Restraints, and Opportunities
13.1.1 Overview
13.1.2 Drivers
13.1.3 Restraints
13.1.4 Opportunities
13.2 Porters Five Forces Analysis
13.2.1 Overview
13.2.2 Bargaining Power of Buyers
13.2.3 Bargaining Power of Suppliers
13.2.4 Degree of Competition
13.2.5 Threat of New Entrants
13.2.6 Threat of Substitutes
13.3 Value Chain Analysis
14 Appendix
 ワックスの日本市場(2026年~2034年) The Japan wax market size reached USD 666.1 Million in 2025 and is projected to reach USD 901.6 Million by 2034, exhibiting a CAGR of 3.32% during 2026-2034. Growing demand from cosmetics, packaging, and candle manufacturing sectors, rising preference for sustainable bio-based wax alternatives, and …
- 靴下の日本市場(2026年~2034年) The Japan hosiery market size was valued at USD 2.57 Billion in 2025 and is projected to reach USD 3.3 Billion by 2034, growing at a compound annual growth rate of 2.90% from 2026-2034. The Japan hosiery market is propelled by enduring cultural preferences for modest, polished dressing, complemented…
- 日本のメンタルヘルス市場(2026年~2034年) The Japan mental health market grew from USD 27.5 Billion in 2025 to USD 28.3 Billion in 2026 and is projected to reach USD 37.6 Billion by 2034, exhibiting a compound annual growth rate of 3.60% during 2026-2034. The market is driven by the growing incidence of anxiety, depression, and stress disor…
- 肉の日本市場(2026年~2034年) The Japan meat market reached USD 37.15 Billion in 2025 and is projected to reach USD 48.64 Billion by 2034, growing at a CAGR of 2.95% during 2026-2034. The market is driven by steady demand for high-quality protein, rising consumption of processed and ready-to-cook meat products, and strong foodse…
- 海藻の日本市場(2026年~2034年) Japan seaweed market size reached USD 571.2 Million in 2025. Looking forward, IMARC Group expects the market to reach USD 1,036.1 Million by 2034, exhibiting a growth rate (CAGR) of 6.84% during 2026-2034. The rising consumer inclination towards plant-based diets and alternative protein sources, alo…